
Page 379 - Read Online
P. 379
Page 8 of 16 Verkoeijen et al. J Cancer Metastasis Treat 2019;5:51 I http://dx.doi.org/10.20517/2394-4722.2019.06
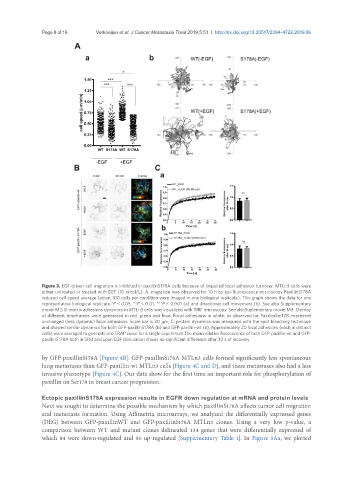
Figure 3. EGF-driven cell migration is inhibited in paxillinS178A cells because of impaired focal adhesion turnover. MTLn3 cells were
either untreated or treated with EGF (10 nmol/L). A: migration was observed for 10 h by epi-fluorescence microscopy PaxillinS178A
reduced cell speed average (about 100 cells per condition were imaged in one biological replicate). This graph shows the data for one
representative biological replicate.*P < 0.05, **P < 0.01, ***P < 0.001 (a) and directional cell movement (b). See also Supplementary
movie M2; B: matrix adhesions dynamics in MTLn3 cells was visualized with TIRF microscopy. See alsoSuplementary movie M3. Overlay
of different timeframes were generated in red, green and blue. Focal adhesions in white, as observed for PaxillinSer178, represent
unchanged (less dynamic) focal adhesions. Scale bar is 20 mm; C: protein dynamics was measured with the spot bleaching technique
and showed similar dynamics for both GFP-paxillinS178A (b) and GFP-paxillin-wt (a). Approximately 20 focal adhesions (each in distinct
cells) were averaged to generate one FRAP curve for a single experiment.The mean relative fluorescence of both GFP-paxillin-wt and GFP-
paxillinS178A both in SFM and upon EGF stimulation shows no significant difference after 30 s of recovery
by GFP-paxillinS178A [Figure 4B]. GFP-paxillinS178A MTLn3 cells formed significantly less spontaneous
lung metastases than GFP-paxillin-wt MTLn3 cells [Figure 4C and D], and these metastases also had a less
invasive phenotype [Figure 4C]. Our data show for the first time an important role for phosphorylation of
paxillin on Ser178 in breast cancer progression.
Ectopic paxillinS178A expression results in EGFR down regulation at mRNA and protein levels
Next we sought to determine the possible mechanism by which paxillinS178A affects tumor cell migration
and metastasis formation. Using Affimetrix microarrays, we analyzed the differentially expressed genes
(DEG) between GFP-paxillinWT and GFP-paxillinS178A MTLn3 clones. Using a very low p-value, a
comparison between WT and mutant clones delineated 134 genes that were differentially expressed of
which 84 were down-regulated and 50 up-regulated [Supplementary Table 1]. In Figure 5Aa, we plotted