
Page 83 - Read Online
P. 83
Page 267 Liu et al. Intell Robot 2024;4(3):256-75 I http://dx.doi.org/10.20517/ir.2024.17
Table 1. Image processor parameters
NVIDIA GeForce NVIDIA GeForce
Property NVIDIA Jetson AGX Orin
RTX 2080Ti RTX 1050Ti
Number of CUDA cores 4,352 768 2,048
Video memory capacity 11 GB 4 GB 32 G
Video memory bandwidth 616 GB/s 112 GB/s 204.8 GB/s
Video memory bus width 352bit 128bit 256bit
Video memory type GDDR6 GDDR5 LPDDR5
Core architecture Turing Pascal Ampere
CUDA: Compute unified device architecture.
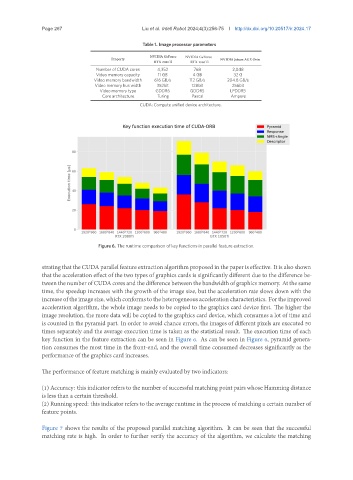
Figure 6. The runtime comparison of key functions in parallel feature extraction.
strating that the CUDA parallel feature extraction algorithm proposed in the paper is effective. It is also shown
that the acceleration effect of the two types of graphics cards is significantly different due to the difference be-
tween the number of CUDA cores and the difference between the bandwidth of graphics memory. At the same
time, the speedup increases with the growth of the image size, but the acceleration rate slows down with the
increase of the image size, which conforms to the heterogeneous acceleration characteristics. For the improved
acceleration algorithm, the whole image needs to be copied to the graphics card device first. The higher the
image resolution, the more data will be copied to the graphics card device, which consumes a lot of time and
is counted in the pyramid part. In order to avoid chance errors, the images of different pixels are executed 50
times separately and the average execution time is taken as the statistical result. The execution time of each
key function in the feature extraction can be seen in Figure 6. As can be seen in Figure 6, pyramid genera-
tion consumes the most time in the front-end, and the overall time consumed decreases significantly as the
performance of the graphics card increases.
The performance of feature matching is mainly evaluated by two indicators:
(1) Accuracy: this indicator refers to the number of successful matching point pairs whose Hamming distance
is less than a certain threshold.
(2) Running speed: this indicator refers to the average runtime in the process of matching a certain number of
feature points.
Figure 7 shows the results of the proposed parallel matching algorithm. It can be seen that the successful
matching rate is high. In order to further verify the accuracy of the algorithm, we calculate the matching