
Page 143 - Read Online
P. 143
Chen et al. Intell Robot 2023;3:420-35 https://dx.doi.org/10.20517/ir.2023.24 Page 428
Table 1. Vibration pattern
Distance Location of obstacle Vibration position Vibration speed
Less than 4 m Right of center Unit 1 2 Hz
More than 2 m Left of center Unit 2 2 Hz
Less than 2 m Right of center Unit 1 4 Hz
Left of center Unit 2 4 Hz
Nothing detected in sight Unit 3 10 Hz
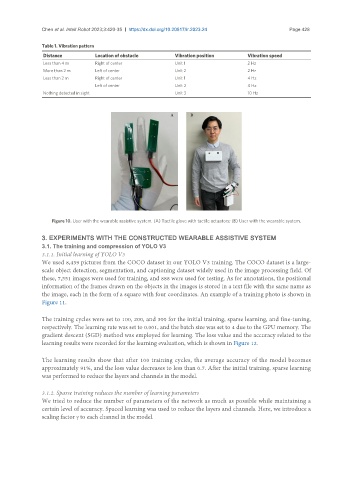
Figure 10. User with the wearable assistive system. (A) Tactile glove with tactile actuators; (B) User with the wearable system.
3. EXPERIMENTS WITH THE CONSTRUCTED WEARABLE ASSISTIVE SYSTEM
3.1. The training and compression of YOLO V3
3.1.1. Initial learning of YOLO V3
We used 8,439 pictures from the COCO dataset in our YOLO V3 training. The COCO dataset is a large-
scale object detection, segmentation, and captioning dataset widely used in the image processing field. Of
these, 7,551 images were used for training, and 888 were used for testing. As for annotations, the positional
information of the frames drawn on the objects in the images is stored in a text file with the same name as
the image, each in the form of a square with four coordinates. An example of a training photo is shown in
Figure 11.
The training cycles were set to 100, 200, and 300 for the initial training, sparse learning, and fine-tuning,
respectively. The learning rate was set to 0.001, and the batch size was set to 4 due to the GPU memory. The
gradient descent (SGD) method was employed for learning. The loss value and the accuracy related to the
learning results were recorded for the learning evaluation, which is shown in Figure 12.
The learning results show that after 100 training cycles, the average accuracy of the model becomes
approximately 91%, and the loss value decreases to less than 0.7. After the initial training, sparse learning
was performed to reduce the layers and channels in the model.
3.1.2. Sparse training reduces the number of learning parameters
We tried to reduce the number of parameters of the network as much as possible while maintaining a
certain level of accuracy. Spaced learning was used to reduce the layers and channels. Here, we introduce a
scaling factor γ to each channel in the model.