
Page 145 - Read Online
P. 145
Chen et al. Intell Robot 2023;3:420-35 https://dx.doi.org/10.20517/ir.2023.24 Page 430
Table 2. Comparison before and after the reduction
Before Layer reduction Channel reduction
Accuracy (mAP) 0.81 0.75 0.73
Parameters 61,523,734 1,424,654 963,752
Inference time (s) 0.014 0.0092 0.0057
Table 3. Accuracy of distance measurement
0.5 m 1 m 1.5 m 2 m 3 m 4 m
1 0.54 m 0.95 m 1.43 m 2.00 m 2.86 m 4.00 m
2 0.53 m 1.06 m 1.43 m 1.82 m 2.86 m 4.00 m
3 0.47 m 0.95 m 1.54 m 1.82 m 3.07 m 4.44 m
4 0.57 m 1.06 m 1.43 m 2.00 m 3.07 m 3.64 m
5 0.57 m 0.91 m 1.54 m 2.00 m 2.86 m 4.00 m
Average error 0.048 m 0.062 m 0.058 m 0.072 m 0.11 m 0.16 m
Standard deviation 0.04 0.07 0.06 0.10 0.12 0.28
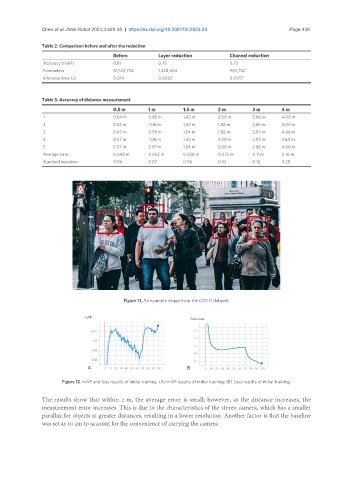
Figure 11. An example image from the COCO dataset.
Figure 12. mAP and loss results of initial training. (A) mAP results of initial training; (B) Loss results of initial training.
The results show that within 2 m, the average error is small; however, as the distance increases, the
measurement error increases. This is due to the characteristics of the stereo camera, which has a smaller
parallax for objects at greater distances, resulting in a lower resolution. Another factor is that the baseline
was set as 10 cm to account for the convenience of carrying the camera.