
Page 146 - Read Online
P. 146
Page 431 Chen et al. Intell Robot 2023;3:420-35 https://dx.doi.org/10.20517/ir.2023.24
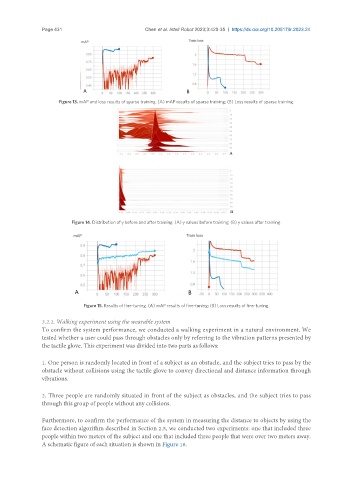
Figure 13. mAP and loss results of sparse training. (A) mAP results of sparse training; (B) Loss results of sparse training.
Figure 14. Distribution of γ before and after training. (A) γ values before training; (B) γ values after training.
Figure 15. Results of fine-tuning. (A) mAP results of fine-tuning; (B) Loss results of fine-tuning.
3.2.2. Walking experiment using the wearable system
To confirm the system performance, we conducted a walking experiment in a natural environment. We
tested whether a user could pass through obstacles only by referring to the vibration patterns presented by
the tactile glove. This experiment was divided into two parts as follows:
1. One person is randomly located in front of a subject as an obstacle, and the subject tries to pass by the
obstacle without collisions using the tactile glove to convey directional and distance information through
vibrations.
2. Three people are randomly situated in front of the subject as obstacles, and the subject tries to pass
through this group of people without any collisions.
Furthermore, to confirm the performance of the system in measuring the distance to objects by using the
face detection algorithm described in Section 2.5, we conducted two experiments: one that included three
people within two meters of the subject and one that included three people that were over two meters away.
A schematic figure of each situation is shown in Figure 16.