
Page 38 - Read Online
P. 38
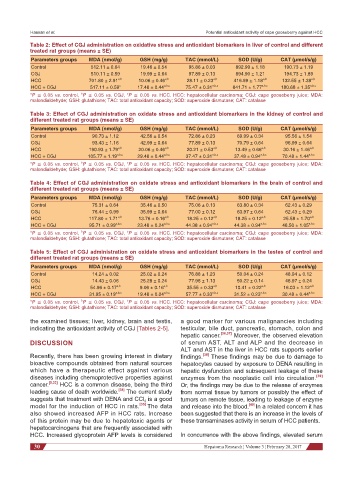
Hassan et al.                                                                                                                                Potential antioxidant activity of cape gooseberry against HCC

           Table 2: Effect of CGJ administration on oxidative stress and antioxidant biomarkers in liver of control and different
           treated rat groups (means ± SE)
           Parameters groups   MDA (nmol/g)     GSH (mg/g)      TAC (mmol/L)     SOD (U/g)      CAT (µmol/s/g)
           Control              512.11 ± 0.64   19.46 ± 0.54     95.86 ± 0.03    892.99 ± 1.18   190.73 ± 1.19
           CGJ                  510.11 ± 0.59   19.99 ± 0.64     97.89 ± 0.13    894.90 ± 1.21   194.73 ± 1.89
           HCC                 701.80 ± 2.91 a,b  10.06 ± 0.46 a,b   28.11 ± 0.23 a,b  416.99 ± 1.18 a,b  132.55 ± 1.38 a,b
           HCC + CGJ           517.11 ± 0.59 c  17.48 ± 0.44 a,b,c  75.47 ± 0.31 a,b,c  841.71 ± 1.77 a,b,c  180.68 ± 1.35 a,b,c
                            b
                                            c
           a P ≤ 0.05 vs. control,  P ≤ 0.05 vs. CGJ,  P ≤ 0.05 vs. HCC. HCC: hepatocellular carcinoma; CGJ: cape gooseberry juice; MDA:
           malondialdehyde; GSH: glutathione; TAC: total antioxidant capacity; SOD: superoxide dismutase; CAT: catalase
           Table 3: Effect of CGJ administration on oxidate stress and antioxidant biomarkers in the kidney of control and
           different treated rat groups (means ± SE)
           Parameters groups   MDA (nmol/g)     GSH (mg/g)      TAC (mmol/L)     SOD (U/g)      CAT (µmol/s/g)
           Control              90.73 ± 1.12    42.56 ± 0.54     72.86 ± 0.23    69.99 ± 0.34    95.56 ± 1.54
           CGJ                  93.43 ± 1.16    42.99 ± 0.64     77.89 ± 0.13    70.79 ± 0.64    96.99 ± 0.64
           HCC                 190.93 ± 1.79 a,b  20.06 ± 0.46 a,b  20.21 ± 0.53 a,b  13.49 ± 0.66 a,b  30.16 ± 1.46 a,b
           HCC + CGJ           105.77 ± 1.19 a,b,c  29.48 ± 0.44 a,b,c  37.47 ± 0.31 a,b,c  37.48 ± 0.94 a,b,c  70.48 ± 1.44 a,b,c
                                            c
                            b
           a P ≤ 0.05 vs. control,  P ≤ 0.05 vs. CGJ,  P ≤ 0.05 vs. HCC. HCC: hepatocellular carcinoma; CGJ: cape gooseberry juice; MDA:
           malondialdehyde; GSH: glutathione; TAC: total antioxidant capacity; SOD: superoxide dismutase; CAT: catalase
           Table 4: Effect of CGJ administration on oxidate stress and antioxidant biomarkers in the brain of control and
           different treated rat groups (means ± SE)
           Parameters groups   MDA (nmol/g)     GSH (mg/g)      TAC (mmol/L)     SOD (U/g)      CAT (µmol/s/g)
           Control              75.31 ± 0.64    35.46 ± 0.50     75.06 ± 0.13    63.80 ± 0.34    62.43 ± 0.29
           CGJ                  76.44 ± 0.99    35.99 ± 0.64     77.00 ± 0.12    63.97 ± 0.64    62.43 ± 0.29
           HCC                 117.80 ± 1.71 a,b  13.76 ± 0.16 a,b  18.25 ± 0.12 a,b  18.25 ± 0.12 a,b  25.58 ± 1.70 a,b
           HCC + CGJ           95.71 ± 0.99 a,b,c  23.48 ± 0.24 a,b,c  44.38 ± 0.94 a,b,c  44.38 ± 0.94 a,b,c  48.50 ± 1.05 a,b,c
           a P ≤ 0.05 vs. control,  P ≤ 0.05 vs. CGJ,  P ≤ 0.05 vs. HCC. HCC: hepatocellular carcinoma; CGJ: cape gooseberry juice; MDA:
                            b
                                            c
           malondialdehyde; GSH: glutathione; TAC: total antioxidant capacity; SOD: superoxide dismutase; CAT: catalase
           Table 5: Effect of CGJ administration on oxidate stress and antioxidant biomarkers in the testes of control and
           different treated rat groups (means ± SE)
           Parameters groups   MDA (nmol/g)     GSH (mg/g)      TAC (mmol/L)     SOD (U/g)      CAT (µmol/s/g)
           Control              14.24 ± 0.02    25.02 ± 0.24     76.88 ± 1.23    50.04 ± 0.24    48.94 ± 0.12
           CGJ                  14.43 ± 0.06    25.28 ± 0.24     77.98 ± 1.13    50.22 ± 0.14    48.97 ± 0.24
           HCC                 54.96 ± 0.17 a,b  9.06 ± 0.16 a,b  35.55 ± 0.33 a,b  10.41 ± 0.22 a,b  16.03 ± 1.12 a,b
           HCC + CGJ           31.95 ± 0.19 a,b,c  19.48 ± 0.04 a,b,c  57.77 ± 0.33 a,b,c  31.52 ± 0.23 a,b,c  30.48 ± 0.44 a,b,c
           a                b               c
            P ≤ 0.05 vs. control,  P ≤ 0.05 vs. CGJ,  P ≤ 0.05 vs. HCC. HCC: hepatocellular carcinoma; CGJ: cape gooseberry juice; MDA:
           malondialdehyde; GSH: glutathione; TAC: total antioxidant capacity; SOD: superoxide dismutase; CAT: catalase
           the examined tissues; liver, kidney, brain and testis,   a good marker for various malignancies including
           indicating the antioxidant activity of CGJ [Tables 2-5].   testicular, bile duct, pancreatic, stomach, colon and
                                                              hepatic cancer. [36,37]  Moreover, the observed elevation
           DISCUSSION                                         of serum AST, ALT and ALP and the decrease in
                                                              ALT and AST in the liver in HCC rats supports earlier
           Recently, there has been growing interest in dietary   findings. [38]  These findings may be due to damage to
           bioactive compounds obtained from natural sources   hepatocytes caused by exposure to DENA resulting in
           which have a therapeutic effect against various    hepatic dysfunction and subsequent leakage of these
           diseases including chemoprotective properties against   enzymes from the neoplastic cell into circulation. [39]
           cancer. [5,33]  HCC is a common disease, being the third   Or, the findings may be due to the release of enzymes
                                         [34]
           leading cause of death worldwide.  The current study   from normal tissue by tumors or possibly the effect of
           suggests that treatment with DENA and CCl 4  is a good   tumors on remote tissue, leading to leakage of enzyme
           model for the induction of HCC in rats. [35]  The data   and release into the blood. [40]  In a related concern it has
           also showed increased AFP in HCC rats. Increase    been suggested that there is an increase in the levels of
           of this protein may be due to hepatotoxic agents or   these transaminases activity in serum of HCC patients.
           hepatocarcinogens that are frequently associated with
           HCC. Increased glycoprotein AFP levels is considered   In concurrence with the above findings, elevated serum
            30                                                                                                      Hepatoma Research ¦ Volume 3 ¦ February 28, 2017