
Page 305 - Read Online
P. 305
Kohla et al. Transforming growth factor β1 in HCC
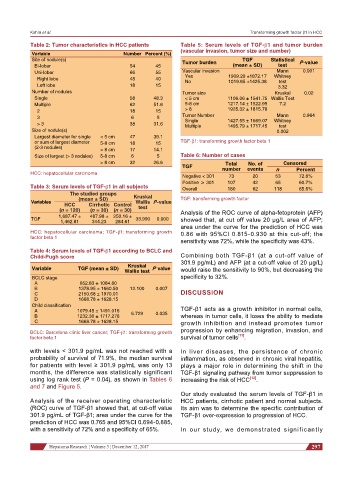
Table 2: Tumor characteristics in HCC patients Table 5: Serum levels of TGF-b1 and tumor burden
(vascular invasion, tumor size and number)
Variable Number Percent (%)
Site of nodule(s) Tumor burden TGF Statistical P-value
Bi-lobar 54 45 (mean ± SD) test
Uni-lobar 66 55 Vascular invasion Mann 0.001
Right lobe 48 40 Yes 1909.29 ±1872.17 Whitney
No
1019.65 ±1425.38
test
Left lobe 18 15 3.32
Number of nodules Tumor size Kruskal 0.02
Single 58 48.3 < 5 cm 1106.06 ± 1541.75 Wallis Test
Multiple 62 51.6 5-8 cm 1217.14 ± 1522.95 7.2
2 18 15 > 8 1925.32 ± 1815.78
Mann
3 6 5 Tumor Number 1427.55 ± 1669.07 Whitney 0.964
Single
> 3 38 31.6 Multiple 1495.79 ± 1717.45 test
Size of nodule(s) 0.002
Largest diameter for single < 5 cm 47 39.1
or sum of largest diameter 5-8 cm 18 15 TGF-b1: transforming growth factor beta 1
(2-3 nodules) > 8 cm 17 14.1
Size of largest (> 3 nodules) 5-8 cm 6 5 Table 6: Number of cases
> 8 cm 32 26.6 Total No. of Censored
TGF number events n Percent
HCC: hepatocellular carcinoma
Negative < 301 73 20 53 72.6%
Positive ≥ 301 107 42 65 60.7%
Table 3: Serum levels of TGF-b1 in all subjects Overall 180 62 118 65.6%
The studied groups
(mean ± SD) Kruskal TGF: transforming growth factor
Variables HCC Cirrhotic Control Wallis P-value
(n = 120) (n = 30) (n = 30) test Analysis of the ROC curve of alpha-fetoprotein (AFP)
1,687.47 ± 487.98 ± 250.16 ±
TGF 33.990 0.000 showed that, at cut off value 20 µg/L area of AFP;
1,462.81 344.23 284.61
area under the curve for the prediction of HCC was
HCC: hepatocellular carcinoma; TGF-b1: transforming growth 0.86 with 95%CI 0.815-0.930 at this cut-off; the
factor beta 1
sensitivity was 72%, while the specificity was 43%.
Table 4: Serum levels of TGF-b1 according to BCLC and
Child-Pugh score Combining both TGF-β1 (at a cut-off value of
301.9 pg/mL) and AFP (at a cut-off value of 20 µg/L)
Kruskal
Variable TGF (mean ± SD) Wallis test P value would raise the sensitivity to 90%, but decreasing the
BCLC stage specificity to 32%.
A 652.83 ± 1084.60
B 1378.95 ± 1660.50 12.100 0.007
C 2150.68 ± 1970.01 DISCUSSION
D 1668.78 ± 1628.15
Child classification
A 1079.45 ± 1491.016 TGF-β1 acts as a growth inhibitor in normal cells,
B 1232.30 ± 1717.276 6.729 0.035 whereas in tumor cells, it loses the ability to mediate
C 1668.78 ± 1628.15 growth inhibition and instead promotes tumor
progression by enhancing migration, invasion, and
BCLC: Barcelona clinic liver cancer; TGF-b1: transforming growth [11]
factor beta 1 survival of tumor cells .
with levels < 301.9 pg/mL was not reached with a In liver diseases, the persistence of chronic
probability of survival of 71.9%, the median survival inflammation, as observed in chronic viral hepatitis,
for patients with level ≥ 301.9 pg/mL was only 13 plays a major role in determining the shift in the
months, the difference was statistically significant TGF-β1 signaling pathway from tumor suppression to
using log rank test (P = 0.04), as shown in Tables 6 increasing the risk of HCC [12] .
and 7 and Figure 5.
Our study evaluated the serum levels of TGF-β1 in
Analysis of the receiver operating characteristic HCC patients, cirrhotic patient and normal subjects.
(ROC) curve of TGF-β1 showed that, at cut-off value Its aim was to determine the specific contribution of
301.9 pg/mL of TGF-β1; area under the curve for the TGF-β1 over-expression to progression of HCC.
prediction of HCC was 0.765 and 95%CI 0.694-0.885,
with a sensitivity of 72% and a specificity of 65%. In our study, we demonstrated significantly
Hepatoma Research ¦ Volume 3 ¦ December 12, 2017 297