Page 304 - Read Online
P. 304

Kohla et al.                                                                                                                                                                         Transforming growth factor β1 in HCC

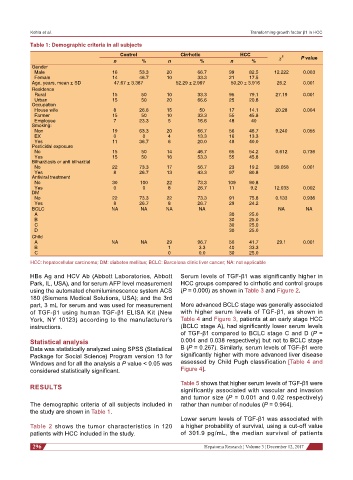
           Table 1: Demographic criteria in all subjects
                                          Control             Cirrhotic           HCC          c 2    P value
                                       n         %        n         %          n      %
            Gender
              Male                     16       53.3     20         66.7      99     82.5     12.222   0.003
              Female                   14       46.7     10         33.3      21     17.5
            Age, years, mean ± SD      47.67 ± 3.387        52.29 ± 2.997      50.20 ± 3.916  26.2     0.001
            Residence
              Rural                    15        50      10         33.3      95     79.1     27.19    0.001
              Urban                    15        50      20         66.6      25     20.8
            Occupation
              House wife               8        26.6     15         50        17     14.1     20.28    0.004
              Farmer                   15        50      10         33.3      55     45.8
              Employee                 7        23.3      5         16.6      48      40
            Smoking:
              Non                      19       63.3     20         66.7      56     46.7     9.240    0.055
              EX                       0         0        4         13.3      16     13.3
              Yes                      11       36.7      6         20.0      48     40.0
            Pesticidal exposure
              No                       15        50      14         46.7      65     54.2     0.612    0.736
              Yes                      15        50      16         53.3      55     45.8
            Bilharziasis or anti bilharzial
              No                       22       73.3     17         56.7      23     19.2     39.058   0.001
              Yes                      8        26.7     13         43.3      97     80.8
            Antiviral treatment
              No                       30       100      22         73.3      109    90.8
              Yes                      0         0        8         26.7      11      9.2     12.033   0.002
            DM
              No                       22       73.3     22         73.3      91     75.8     0.133    0.936
              Yes                      8        26.7      8         26.7      29     24.2
            BCLC                       NA       NA       NA         NA                         NA       NA
              A                                                               30     25.0
              B                                                               30     25.0
              C                                                               30     25.0
              D                                                               30     25.0
            Child
              A                        NA       NA       29         96.7      50     41.7     29.1     0.001
              B                                           1         3.3       40     33.3
              C                                           0         0.0       30     25.0
           HCC: hepatocellular carcinoma; DM: diabetes mellitus; BCLC: Barcelona clinic liver cancer; NA: not applicable
           HBs Ag and HCV Ab (Abbott Laboratories, Abbott     Serum levels of TGF-β1 was significantly higher in
           Park, IL, USA), and for serum AFP level measurement   HCC groups compared to cirrhotic and control groups
           using the automated chemiluminescence system ACS   (P = 0.000) as shown in Table 3 and Figure 2.
           180 (Siemens Medical Solutions, USA); and the 3rd
           part, 3 mL for serum and was used for measurement   More advanced BCLC stage was generally associated
           of TGF-β1 using human TGF-β1 ELISA Kit (New        with higher serum levels of TGF-β1, as shown in
           York, NY 10123) according to the manufacturer’s    Table 4 and Figure 3, patients at an early stage HCC
           instructions.                                      (BCLC stage A), had significantly lower serum levels
                                                              of TGF-β1 compared to BCLC stage C and D (P =
           Statistical analysis                               0.004 and 0.038 respectively) but not to BCLC stage
           Data was statistically analyzed using SPSS (Statistical   B (P = 0.267). Similarly, serum levels of TGF-β1 were
           Package for Social Science) Program version 13 for   significantly higher with more advanced liver disease
           Windows and for all the analysis a P value < 0.05 was   assessed by Child Pugh classification [Table 4 and
           considered statistically significant.              Figure 4].

                                                              Table 5 shows that higher serum levels of TGF-β1 were
           RESULTS                                            significantly associated with vascular and invasion
                                                              and tumor size (P = 0.001 and 0.02 respectively)
           The demographic criteria of all subjects included in   rather than number of nodules (P = 0.964).
           the study are shown in Table 1.
                                                              Lower serum levels of TGF-β1 was associated with
           Table  2  shows  the  tumor  characteristics  in  120   a higher probability of survival, using a cut-off value
           patients with HCC included in the study.           of 301.9 pg/mL, the median survival of patients

            296                                                                                                     Hepatoma Research ¦ Volume 3 ¦ December 12, 2017
   299   300   301   302   303   304   305   306   307   308   309