
Page 327 - Read Online
P. 327
Loria et al. CEUS in evaluation of vascularization of HCC
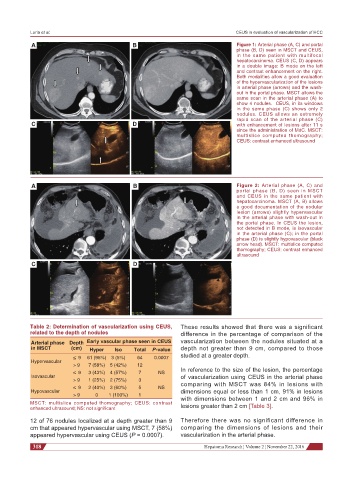
A B Figure 1: Arterial phase (A, C) and portal
phase (B, D) seen in MSCT and CEUS,
in the same patient with multifocal
hepatocarcinoma. CEUS (C, D) appears
in a double image: B mode on the left
and contrast enhancement on the right.
Both modalities allow a good evaluation
of the hypervascularization of the lesions
in arterial phase (arrows) and the wash-
out in the portal phase. MSCT allows the
same scan in the arterial phase (A) to
show 4 nodules. CEUS, in its windows
in the same phase (C) shows only 2
nodules. CEUS allows an extremely
rapid scan of the arterial phase (C)
C D with enhancement of lesions after 11 s
since the administration of MdC. MSCT:
multislice computed thomography;
CEUS: contrast enhanced ultrasound
A B Figure 2: Arterial phase (A, C) and
portal phase (B, D) seen in MSCT
and CEUS in the same patient with
hepatocarcinoma. MSCT (A, B) allows
a good documentation of the nodular
lesion (arrows) slightly hypervascular
in the arterial phase with wash-out in
the portal phase. In CEUS the lesion,
not detected in B mode, is isovascular
in the arterial phase (C); in the portal
phase (D) is slightly hypovascular (black
arrow head). MSCT: multislice computed
thomography; CEUS: contrast enhanced
ultrasound
C D
Table 2: Determination of vascularization using CEUS, These results showed that there was a significant
related to the depth of nodules difference in the percentage of comparison of the
Arterial phase Depth Early vascular phase seen in CEUS vascularization between the nodules situated at a
in MSCT (cm) Hyper Iso Total P-value depth not greater than 9 cm, compared to those
≤ 9 61 (95%) 3 (5%) 64 0.0007 studied at a greater depth.
Hypervascular
> 9 7 (58%) 5 (42%) 12
≤ 9 3 (43%) 4 (57%) 7 NS In reference to the size of the lesion, the percentage
Isovascular of vascularization using CEUS in the arterial phase
> 9 1 (25%) 2 (75%) 3
≤ 9 2 (40%) 3 (60%) 5 NS comparing with MSCT was 84% in lesions with
Hypovascular dimensions equal or less than 1 cm, 91% in lesions
> 9 0 1 (100%) 1 with dimensions between 1 and 2 cm and 96% in
MSCT: multislice computed thomography; CEUS: contrast
enhanced ultrasound; NS: not significant lesions greater than 2 cm [Table 3].
12 of 76 nodules localized at a depth greater than 9 Therefore there was no significant difference in
cm that appeared hypervascular using MSCT, 7 (58%) comparing the dimensions of lesions and their
appeared hypervascular using CEUS (P = 0.0007). vascularization in the arterial phase.
318 Hepatoma Research ¦ Volume 2 ¦ November 22, 2016