
Page 132 - Read Online
P. 132
Page 8 of 15 Turati et al. Hepatoma Res 2022;8:19 https://dx.doi.org/10.20517/2394-5079.2021.130
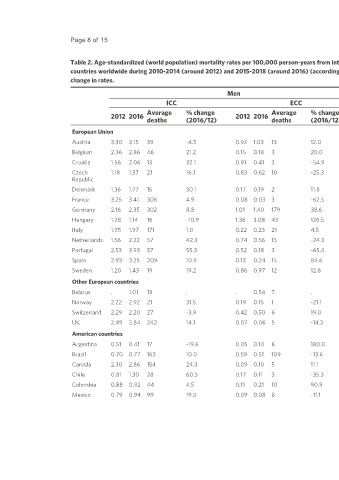
Table 2. Age-standardized (world population) mortality rates per 100,000 person-years from intrahepatic and extrahepatic cholangiocarcinoma (ICC and ECC) in the age group 45-64 in selected
countries worldwide during 2010-2014 (around 2012) and 2015-2018 (around 2016) (according to data availability), annual average deaths of the latest period, and the corresponding percent
change in rates.
Men Women
ICC ECC ICC ECC
Average % change Average % change Average % change Average % change
2012 2016 2012 2016 2012 2016 2012 2016
deaths (2016/12) deaths (2016/12) deaths (2016/12) deaths (2016/12)
European Union
Austria 3.30 3.15 39 -4.5 0.92 1.03 13 12.0 2.19 1.88 24 -14.2 0.74 0.80 10 8.1
Belgium 2.36 2.86 46 21.2 0.15 0.18 3 20.0 2.05 1.82 29 -11.2 0.09 0.03 1 -66.7
Croatia 1.56 2.06 13 32.1 0.91 0.41 3 -54.9 1.50 1.25 8 -16.7 0.57 0.42 3 -26.3
Czech 1.18 1.37 21 16.1 0.83 0.62 10 -25.3 0.80 0.81 13 1.3 0.53 0.58 9 9.4
Republic
Denmark 1.36 1.77 15 30.1 0.17 0.19 2 11.8 1.34 1.83 15 36.6 0.37 0.16 1 -56.8
France 3.25 3.41 306 4.9 0.08 0.03 3 -62.5 1.93 1.85 178 -4.1 0.05 0.05 5 0.0
Germany 2.16 2.35 302 8.8 1.01 1.40 179 38.6 1.58 1.81 237 14.6 0.89 0.97 126 9.0
Hungary 1.28 1.14 16 -10.9 1.36 3.08 43 126.5 0.66 0.88 14 33.3 1.04 2.12 34 103.8
Italy 1.95 1.97 171 1.0 0.22 0.23 21 4.5 1.19 1.36 126 14.3 0.10 0.12 12 20.0
Netherlands 1.56 2.22 57 42.3 0.74 0.56 15 -24.3 1.30 2.18 55 67.7 0.60 0.55 14 -8.3
Portugal 2.53 3.93 57 55.3 0.52 0.18 3 -65.4 1.26 1.83 30 45.2 0.41 0.11 2 -73.2
Spain 2.93 3.25 209 10.9 0.13 0.24 15 84.6 1.53 1.94 129 26.8 0.04 0.11 8 175.0
Sweden 1.20 1.43 19 19.2 0.86 0.97 12 12.8 1.19 1.01 13 -15.1 0.81 1.04 14 28.4
Other European countries
Belarus . 1.01 13 . . 0.54 7 . . 0.65 10 . . 0.41 6 .
Norway 2.22 2.92 21 31.5 0.19 0.15 1 -21.1 1.87 2.02 14 8.0 0.07 0.07 1 0.0
Switzerland 2.29 2.20 27 -3.9 0.42 0.50 6 19.0 1.77 1.79 22 1.1 0.54 0.22 3 -59.3
UK 2.49 2.84 242 14.1 0.07 0.06 5 -14.3 2.46 2.67 236 8.5 0.06 0.04 4 -33.3
American countries
Argentina 0.51 0.41 17 -19.6 0.05 0.14 6 180.0 0.36 0.32 15 -11.1 0.04 0.16 8 300.0
Brazil 0.70 0.77 163 10.0 0.59 0.51 109 -13.6 0.71 0.86 205 21.1 0.78 0.67 160 -14.1
Canada 2.30 2.86 154 24.3 0.09 0.10 5 11.1 2.19 2.46 134 12.3 0.07 0.08 5 14.3
Chile 0.81 1.30 28 60.5 0.17 0.11 3 -35.3 0.89 1.39 33 56.2 0.14 0.13 3 -7.1
Colombia 0.88 0.92 44 4.5 0.11 0.21 10 90.9 1.01 1.24 66 22.8 0.15 0.26 14 73.3
Mexico 0.79 0.94 99 19.0 0.09 0.08 8 -11.1 1.26 1.30 149 3.2 0.13 0.14 16 7.7