
Page 127 - Read Online
P. 127
Page 4 of 15 Turati et al. Hepatoma Res 2022;8:19 https://dx.doi.org/10.20517/2394-5079.2021.130
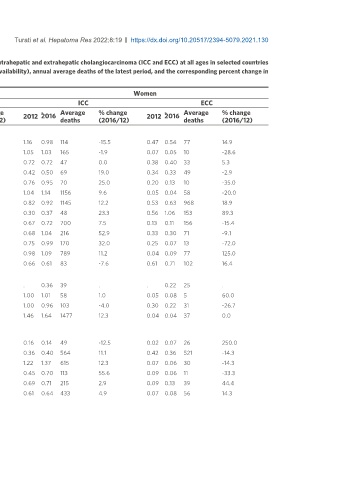
Table 1. Age-standardized (world population) mortality rates per 100,000 person-years from intrahepatic and extrahepatic cholangiocarcinoma (ICC and ECC) at all ages in selected countries
worldwide during 2010-2014 (around 2012) and 2015-2018 (around 2016) (according to data availability), annual average deaths of the latest period, and the corresponding percent change in
rates
Men Women
ICC ECC ICC ECC
a
a
a
2012 2016 Average % change 2012 a 2016 Average % change 2012 2016 Average % change 2012 2016 Average % change
deaths (2016/12) deaths (2016/12) deaths (2016/12) deaths (2016/12)
European Union
Austria 1.75 1.73 160 -1.1 0.66 0.76 79 15.2 1.16 0.98 114 -15.5 0.47 0.54 77 14.9
Belgium 1.35 1.63 190 20.7 0.12 0.12 16 0.0 1.05 1.03 165 -1.9 0.07 0.05 10 -28.6
Croatia 1.02 1.09 46 6.9 0.63 0.58 28 -7.9 0.72 0.72 47 0.0 0.38 0.40 33 5.3
Czech Republic 0.60 0.67 69 11.7 0.52 0.48 54 -7.7 0.42 0.50 69 19.0 0.34 0.33 49 -2.9
Denmark 0.78 1.01 61 29.5 0.13 0.10 8 -23.1 0.76 0.95 70 25.0 0.20 0.13 10 -35.0
France 1.78 1.89 1336 6.2 0.07 0.05 48 -28.6 1.04 1.14 1156 9.6 0.05 0.04 58 -20.0
Germany 1.15 1.27 1264 10.4 0.70 0.92 1008 31.4 0.82 0.92 1145 12.2 0.53 0.63 968 18.9
Hungary 0.48 0.53 48 10.4 0.69 1.48 133 114.5 0.30 0.37 48 23.3 0.56 1.06 153 89.3
Italy 1.00 1.11 837 11.0 0.21 0.19 173 -9.5 0.67 0.72 700 7.5 0.13 0.11 156 -15.4
Netherlands 0.91 1.24 232 36.3 0.40 0.33 64 -17.5 0.68 1.04 216 52.9 0.33 0.30 71 -9.1
Portugal 1.40 2.12 252 51.4 0.36 0.14 18 -61.1 0.75 0.99 170 32.0 0.25 0.07 13 -72.0
Spain 1.69 1.86 967 10.1 0.09 0.17 100 88.9 0.98 1.09 789 11.2 0.04 0.09 77 125.0
Sweden 0.68 0.81 86 19.1 0.54 0.69 82 27.8 0.66 0.61 83 -7.6 0.61 0.71 102 16.4
Other European countries
Belarus . 0.58 39 . . 0.44 28 . . 0.36 39 . . 0.22 25 .
Norway 1.06 1.36 68 28.3 0.07 0.11 5 57.1 1.00 1.01 58 1.0 0.05 0.08 5 60.0
Switzerland 1.23 1.39 125 13.0 0.32 0.36 35 12.5 1.00 0.96 103 -4.0 0.30 0.22 31 -26.7
UK 1.55 1.71 1232 10.3 0.05 0.06 44 20.0 1.46 1.64 1477 12.3 0.04 0.04 37 0.0
American
countries
Argentina 0.23 0.19 53 -17.4 0.04 0.09 24 125.0 0.16 0.14 49 -12.5 0.02 0.07 26 250.0
Brazil 0.35 0.42 470 20.0 0.34 0.30 333 -11.8 0.36 0.40 564 11.1 0.42 0.36 521 -14.3
Canada 1.40 1.69 632 20.7 0.07 0.07 30 0.0 1.22 1.37 615 12.3 0.07 0.06 30 -14.3
Chile 0.50 0.83 107 66.0 0.09 0.12 15 33.3 0.45 0.70 113 55.6 0.09 0.06 11 -33.3
Colombia 0.55 0.58 140 5.5 0.09 0.13 32 44.4 0.69 0.71 215 2.9 0.09 0.13 39 44.4
Mexico 0.44 0.49 286 11.4 0.05 0.06 40 20.0 0.61 0.64 433 4.9 0.07 0.08 56 14.3