
Page 128 - Read Online
P. 128
Turati et al. Hepatoma Res 2022;8:19 https://dx.doi.org/10.20517/2394-5079.2021.130 Page 5 of 15
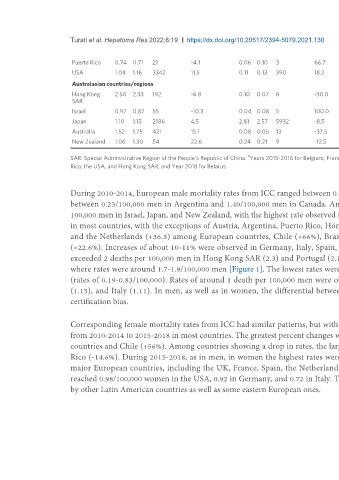
Puerto Rico 0.74 0.71 21 -4.1 0.06 0.10 3 66.7 0.48 0.41 19 -14.6 0.07 0.04 2 -42.9
USA 1.04 1.16 3342 11.5 0.11 0.13 390 18.2 0.82 0.98 3311 19.5 0.08 0.10 382 25.0
Australasian countries/regions
Hong Kong 2.50 2.33 192 -6.8 0.10 0.07 6 -30.0 1.71 1.68 171 -1.8 0.05 0.04 3 -20.0
SAR
Israel 0.97 0.87 55 -10.3 0.04 0.08 5 100.0 0.86 0.79 59 -8.1 0.05 0.07 6 40.0
Japan 1.10 1.15 2186 4.5 2.81 2.57 5932 -8.5 0.57 0.58 1579 1.8 1.37 1.19 4698 -13.1
Australia 1.52 1.75 421 15.1 0.08 0.05 13 -37.5 1.23 1.47 406 19.5 0.05 0.02 9 -60.0
New Zealand 1.06 1.30 54 22.6 0.24 0.21 9 -12.5 1.02 0.81 39 -20.6 0.14 0.16 8 14.3
a
SAR: Special Administrative Region of the People’s Republic of China. Years 2015-2016 for Belgium, France, the UK, and New Zealand; Years 2015-2017 for Croatia, Italy, Spain, Canada, Colombia, Mexico, Puerto
Rico, the USA, and Hong Kong SAR; and Year 2018 for Belarus.
During 2010-2014, European male mortality rates from ICC ranged between 0.48/100,000 in Hungary and 1.78/100,000 in France. The American rates ranged
between 0.23/100,000 men in Argentina and 1.40/100,000 men in Canada. Among the Australasian countries, ICC mortality rates were around 1 death per
100,000 men in Israel, Japan, and New Zealand, with the highest rate observed in Hong Kong SAR at 2.5/100,000 men. Between 2012 and 2016, rates increased
in most countries, with the exceptions of Austria, Argentina, Puerto Rico, Hong Kong SAR, and Israel. The greatest rises were observed in Portugal (+51.4%)
and the Netherlands (+36.3) among European countries, Chile (+66%), Brazil, and Canada (about +20%) among American countries, and New Zealand
(+22.6%). Increases of about 10-11% were observed in Germany, Italy, Spain, the UK, and the USA. In the most recent considered period, the highest rates
exceeded 2 deaths per 100,000 men in Hong Kong SAR (2.3) and Portugal (2.1), followed by France, Spain, Austria, and the UK among European countries,
where rates were around 1.7-1.9/100,000 men [Figure 1]. The lowest rates were registered in Latin American countries and some eastern European countries
(rates of 0.19-0.83/100,000). Rates of around 1 death per 100,000 men were observed in several countries including Germany (1.27), the USA (1.16), Japan
(1.15), and Italy (1.11). In men, as well as in women, the differential between the highest and the lowest rates was over 10-fold, possibly attributable to
certification bias.
Corresponding female mortality rates from ICC had similar patterns, but with lower values than those of males. Apart from a few exceptions, rates increased
from 2010-2014 to 2015-2018 in most countries. The greatest percent changes were observed in the Netherlands (+53%) and Portugal (+32%) among European
countries and Chile (+56%). Among countries showing a drop in rates, the largest percent changes were in Austria (-15.5%), Argentina (-12.5%), and Puerto
Rico (-14.6%). During 2015-2018, as in men, in women the highest rates were observed in Hong Kong SAR, with a rate of 1.68/100,000, followed by some
major European countries, including the UK, France, Spain, the Netherlands, Belgium, and Norway, but also Australia and Canada [Figure 1]. ICC rates
reached 0.98/100,000 women in the USA, 0.92 in Germany, and 0.72 in Italy. The lowest rate was registered in Argentina, with 0.14/100,000 women, followed
by other Latin American countries as well as some eastern European ones.