
Page 137 - Read Online
P. 137
Page 10 of 15 Turati et al. Hepatoma Res 2022;8:19 https://dx.doi.org/10.20517/2394-5079.2021.130
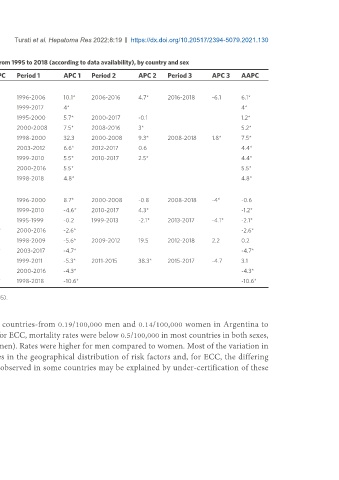
Table 3. Joinpoint analysis for intrahepatic and extrahepatic cholangiocarcinoma (ICC and ECC), from 1995 to 2018 (according to data availability), by country and sex
Period 1 APC 1 Period 2 APC 2 Period 3 APC 3 AAPC Period 1 APC 1 Period 2 APC 2 Period 3 APC 3 AAPC
ICC
Brazil 1996-2011 8.1* 2011-2018 3.2* 6.5* 1996-2006 10.1* 2006-2016 4.7* 2016-2018 -6.1 6.1*
USA 1999-2017 3.6* 3.6* 1999-2017 4* 4*
Japan 1995-2001 5.9* 2001-2017 0.3 1.8* 1995-2000 5.7* 2000-2017 -0.1 1.2*
France 2000-2013 5.6* 2013-2016 -0.2 4.5* 2000-2008 7.5* 2008-2016 3* 5.2*
Germany 1998-2006 14* 2006-2018 1.8* 6.5* 1998-2000 32.3 2000-2008 9.3* 2008-2018 1.8* 7.5*
Italy 2003-2007 11.5* 2007-2017 3.6* 5.8* 2003-2012 6.6* 2012-2017 0.6 4.4*
Spain 1999-2011 6.3* 2011-2017 2.1* 4.9* 1999-2010 5.5* 2010-2017 2.5* 4.4*
UK 2000-2016 4.8* 4.8* 2000-2016 5.5* 5.5*
Australia 1998-2018 4.3* 4.3* 1998-2018 4.8* 4.8*
s
Brazil 1996-2001 11.1* 2001-2018 -2.3* 0.6 1996-2000 8.7* 2000-2008 -0.8 2008-2018 -4* -0.6
USA 1999-2008 -5.4* 2008-2013 -1.1 2013-2017 5.9* -1.8* 1999-2010 -4.6* 2010-2017 4.3* -1.2*
Japan 1995-2012 -1* 2012-2017 -2.4* -1.3* 1995-1999 -0.2 1999-2013 -2.1* 2013-2017 -4.1* -2.1*
France 2000-2016 -3.4* -3.4* 2000-2016 -2.6* -2.6*
Germany 1998-2009 -3* 2009-2013 14.8* 2013-2018 3.9 2.1 1998-2009 -5.6* 2009-2012 19.5 2012-2018 2.2 0.2
Italy 2003-2017 -3.5* -3.5* 2003-2017 -4.7* -4.7*
Spain 1999-2011 -4.5* 2011-2014 58.7 2014-2017 -0.4 4.6 1999-2011 -5.3* 2011-2015 38.3* 2015-2017 -4.7 3.1
UK 2000-2016 -2.6 -2.6 2000-2016 -4.3* -4.3*
Australia 1998-2018 -9.3* -9.3* 1998-2018 -10.6* -10.6*
APC: Annual percent change; AAPC: average annual percent change; *significantly different from 0 (P < 0.05).
We documented a wide variation in ICC mortality rates among the studied countries-from 0.19/100,000 men and 0.14/100,000 women in Argentina to
2.3/100,000 men and 1.7/100,000 women in Hong Kong SAR around 2016. As for ECC, mortality rates were below 0.5/100,000 in most countries in both sexes,
with the highest rates observed in Japan (2.6/100,000 men and 1.2/100,000 women). Rates were higher for men compared to women. Most of the variation in
the mortality of these cancers worldwide can be accounted for by differences in the geographical distribution of risk factors and, for ECC, the differing
prevalence of the use of cholecystectomy. Particularly for ICC, the low rates observed in some countries may be explained by under-certification of these
cancers.