
Page 131 - Read Online
P. 131
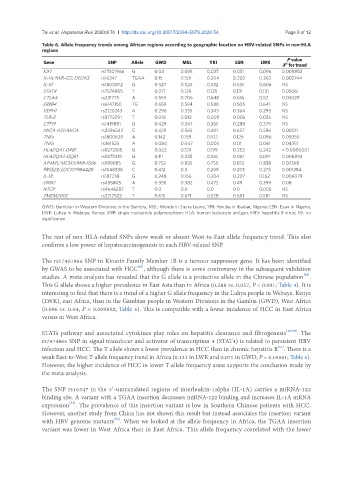
Tai et al. Hepatoma Res 2020;6:74  I  http://dx.doi.org/10.20517/2394-5079.2020.54                                                Page 9 of 12

               Table 6. Allele frequency trends among African regions according to geographic location on HBV-related SNPs in non-HLA
               regions
                                                                                                  P value
                Gene                 SNP     Allele  GWD       MSL      YRI     ESN      LWK     2
                                                                                                X  for trend
                KIF1               rs17401966  G     0.04     0.035    0.037    0.051   0.096   0.009852
                IL-1A/MIR-122; DELINS  rs16347   TGAA  0.15   0.159    0.204    0.202   0.263   0.002744
                IL-10              rs1800872  G      0.527    0.524    0.532    0.551   0.606   NS
                STAT4              rs7574865  T      0.071    0.129    0.125    0.131   0.131   0.05661
                CTLA4              rs231775   A      0.593    0.706    0.648    0.616   0.52    0.05029
                ERBB4              rs6147150  TG     0.659    0.594    0.588    0.505   0.641   NS
                VEPH1              rs2120243  A      0.296    0.335    0.343    0.364   0.293   NS
                TLR-3              rs3775291  T      0.018    0.012    0.009    0.005   0.035   NS
                CTF19              rs1419881  G      0.429    0.347    0.361    0.288   0.379   NS
                MICA-AS1/MICA      rs2596542  C      0.429    0.565    0.491    0.657   0.586   0.00011
                TNFa               rs1800629  A      0.142    0.159    0.102    0.126   0.086   0.05056
                TNFa               rs361525   A      0.084    0.047    0.005    0.01    0.061   0.04351
                HLADQA1-DRB1       rs9272105  G      0.062    0.129    0.199    0.253   0.242   < 0.0000001
                HLADQA2-DQB1       rs9275319  G      0.111    0.235    0.106    0.061   0.091   0.008894
                AP4M1/MCM7/MIR-106b  rs999885   G    0.752    0.835    0.755    0.813   0.838   0.07368
                PRSS23/LOC107984428  rs1048338  C    0.412    0.3      0.259    0.273   0.273   0.001384
                IL-18              rs187238   G      0.248    0.166    0.204    0.207   0.162   0.006079
                GRIK1              rs455805   A      0.358    0.382    0.472    0.49    0.399   0.08
                NTCP               rs4646287  T      0.0      0.0      0.0      0.0     0.005   NS
                TMEM200C           rs2212522  T      0.615    0.671    0.528    0.581   0.581   NS
               GWD: Gambian in Western Divisions in the Gambia; MSL: Mende in Sierra Leone; YRI: Yoruba in Ibadan, Nigeria; ESN: Esan in Nigeria;
               LWK: Luhya in Webuye, Kenya; SNP: single nucleotide polymorphism; HLA: human leukocyte antigen; HBV: hepatitis B virus; NS: no
               significance


               The rest of non-HLA-related SNPs show weak or absent West-to-East allele frequency trend. This also
               confirms a low power of hepatocarcinogenesis in each HBV-related SNP.


               The rs17401966 SNP in Kinesin Family Member 1B is a tumour suppressor gene. It has been identified
                                               [47]
               by GWAS to be associated with HCC , although there is some controversy in the subsequent validation
               studies. A meta-analysis has revealed that the G allele is a protective allele in the Chinese population .
                                                                                                       [48]
               This G allele shows a higher prevalence in East Asia than in Africa (0.288 vs. 0.057, P < 0.001; Table 4). It is
               interesting to find that there is a trend of a higher G allele frequency in the Luhya people in Webuye, Kenya
               (LWK), east Africa, than in the Gambian people in Western Divisions in the Gambia (GWD), West Africa
               (0.096 vs. 0.04, P = 0.009852; Table 6). This is compatible with a lower incidence of HCC in East Africa
               versus in West Africa.

               STATs pathway and associated cytokines play roles on hepatitis clearance and fibrogenesis [49,50] . The
               rs7574865 SNP in signal transducer and activator of transcription 4 (STAT4) is related to persistent HBV
                                                                                               [51]
               infection and HCC. The T allele shows a lower prevalence in HCC than in chronic hepatitis B . There is a
               weak East-to-West T-allele frequency trend in Africa (0.131 in LWK and 0.071 in GWD; P = 0.05561; Table 6).
               However, the higher incidence of HCC in lower T-allele frequency areas supports the conclusion made by
               the meta-analysis.


               The SNP rs16347 in the 3’-untranslated regions of interleukin-1alpha (IL-1A) carries a miRNA-122
               binding site. A variant with a TGAA insertion decreases miRNA-122 binding and increases IL-1A mRNA
               expression . The prevalence of this insertion variant is low in Southern Chinese patients with HCC.
                        [52]
               However, another study from China has not shown this result but instead associates the insertion variant
               with HBV genome mutants . When we looked at the allele frequency in Africa, the TGAA insertion
                                       [53]
               variant was lower in West Africa than in East Africa. This allele frequency correlated with the lower