
Page 129 - Read Online
P. 129
Tai et al. Hepatoma Res 2020;6:74 I http://dx.doi.org/10.20517/2394-5079.2020.54 Page 7 of 12
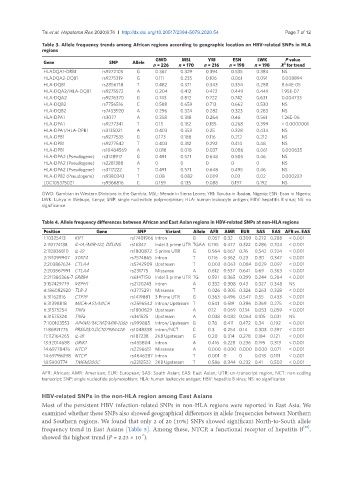
Table 3. Allele frequency trends among African regions according to geographic location on HBV-related SNPs in HLA
regions
GWD MSL YRI ESN LWK P value
Gene SNP Allele 2
n = 226 n = 170 n = 216 n = 198 n = 198 X for trend
HLADQA1-DRB1 rs9272105 G 0.367 0.329 0.394 0.535 0.384 NS
HLADQA2-DQB1 rs9275319 G 0.111 0.235 0.106 0.061 0.091 0.008894
HLA-DQB1 rs2856718 T 0.482 0.371 0.343 0.354 0.288 8.64E-05
HLA-DQA2/HLA-DQB1 rs9275572 A 0.204 0.412 0.472 0.449 0.449 1.95E-07
HLA-DQA2 rs9276370 G 0.743 0.812 0.722 0.742 0.631 0.004733
HLA-DQB2 rs7756516 C 0.588 0.659 0.713 0.662 0.530 NS
HLA-DQB2 rs7453920 A 0.296 0.324 0.282 0.323 0.283 NS
HLA-DPA1 rs3077 A 0.358 0.318 0.264 0.46 0.561 1.26E-06
HLA-DPA1 rs9277341 T 0.15 0.182 0.185 0.268 0.399 < 0.0000001
HLA-DPA1/HLA-DPB1 rs3135021 A 0.403 0.353 0.25 0.328 0.434 NS
HLA-DPB1 rs9277535 G 0.173 0.188 0.116 0.212 0.212 NS
HLA-DPB1 rs9277542 T 0.403 0.312 0.292 0.414 0.48 NS
HLA-DPB1 rs10484569 A 0.018 0.018 0.037 0.086 0.061 0.000635
HLA-DPA2 (Pseudogene) rs3128917 G 0.491 0.571 0.648 0.505 0.46 NS
HLA-DPA2 (Pseudogene) rs2281388 A 0 0 0 0 0 NS
HLA-DPA2 (Pseudogene) rs3117222 T 0.491 0.571 0.648 0.495 0.46 NS
HLA-DPB2 (Pseudogene) rs9380343 T 0.08 0.082 0.009 0.03 0.02 0.000223
LOC105375021 rs9366816 C 0.159 0.135 0.088 0.197 0.192 NS
GWD: Gambian in Western Divisions in the Gambia; MSL: Mende in Sierra Leone; YRI: Yoruba in Ibadan, Nigeria; ESN: Esan in Nigeria;
LWK: Luhya in Webuye, Kenya; SNP: single nucleotide polymorphism; HLA: human leukocyte antigen; HBV: hepatitis B virus; NS: no
significance
Table 4. Allele frequency differences between African and East Asian regions in HBV-related SNPs at non-HLA regions
Position Gene SNP Variant Allele AFR AMR EUR SAS EAS AFR vs. EAS
1:10325413 KIF1 rs17401966 Intron G 0.057 0.32 0.309 0.272 0.288 < 0.001
2:112774138 IL-1A/MIR-122; DELINS rs16347 Indel 3 prime UTR TGAA 0.195 0.477 0.322 0.286 0.704 < 0.001
2:112836810 IL-10 rs1800872 5 prime UTR G 0.564 0.667 0.76 0.542 0.324 < 0.001
2:191099907 STAT4 rs7574865 Intron T 0.116 0.362 0.23 0.30 0.347 < 0.001
2:203867624 CTLA4 rs5742909 Upstream T 0.003 0.063 0.084 0.029 0.097 < 0.001
2:203867991 CTLA4 rs231775 Missense A 0.612 0.537 0.641 0.69 0.363 < 0.001
2:211380366-7 ERBB4 rs6147150 Indel 3 prime UTR TG 0.591 0.365 0.399 0.244 0.284 < 0.001
3:157429779 VEPH1 rs2120243 intron A 0.332 0.308 0.43 0.327 0.348 NS
4:186082920 TLR-3 rs3775291 Missense T 0.026 0.305 0.324 0.263 0.328 < 0.001
6:31162816 CTF19 rs1419881 3 Prime UTR G 0.363 0.496 0.547 0.55 0.433 < 0.001
6:31398818 MICA-AS1/MICA rs2596542 Intron/Upstream T 0.541 0.519 0.396 0.369 0.275 < 0.001
6:31575254 TNFa rs1800629 Upstream A 0.12 0.069 0.134 0.053 0.059 < 0.001
6:31575324 TNFa rs361525 Upstream A 0.038 0.082 0.064 0.105 0.031 NS
7:100103553 AP4M1/MCM7/MIR-106b rs999885 Intron/Upstream G 0.78 0.411 0.472 0.34 0.192 < 0.001
11:86921775 PRSS23/LOC107984428 rs1048338 intron/NCT C 0.3 0.254 0.14 0.303 0.397 < 0.001
11:112164265 IL-18 rs187238 2KB Upstream G 0.20 0.314 0.278 0.184 0.121 < 0.001
13:32014688 GRIK1 rs455804 Intron A 0.416 0.228 0.236 0.195 0.313 < 0.001
14:69778476 NTCP rs2296651 Missense A 0.000 0.000 0.000 0.000 0.071 < 0.001
14:69796098 NTCP rs4646287 Intron T 0.001 0 0 0.018 0.101 < 0.001
18:5900774 TMEM200C rs2212522 2KB Upstream T 0.586 0.344 0.232 0.41 0.502 < 0.001
AFR: African; AMR: American; EUR: European; SAS: South Asian; EAS: East Asian; UTR: un-transcript region; NCT: non-coding
transcript; SNP: single nucleotide polymorphism; HLA: human leukocyte antigen; HBV: hepatitis B virus; NS: no significance
HBV-related SNPs in the non-HLA region among East Asians
Most of the persistent HBV infection-related SNPs in non-HLA regions were reported in East Asia. We
examined whether these SNPs also showed geographical differences in allele frequencies between Northern
and Southern regions. We found that only 2 of 20 (10%) SNPs showed significant North-to-South allele
[40]
frequency trend in East Asians [Table 5]. Among these, NTCP, a functional receptor of hepatitis B ,
showed the highest trend (P = 2.23 × 10 ).
-6