
Page 19 - Read Online
P. 19
Page 4 of 10 Fowler et al. Hepatoma Res 2020;6:19 I http://dx.doi.org/10.20517/2394-5079.2020.21
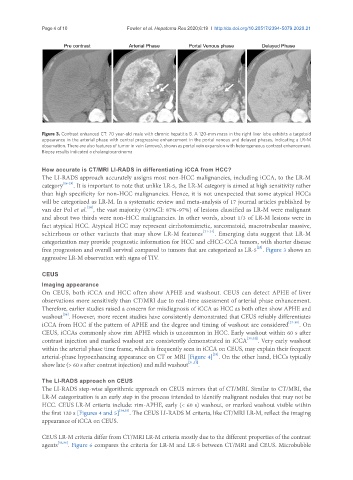
Figure 3. Contrast enhanced CT: 70 year-old male with chronic hepatitis B. A 120-mm mass in the right liver lobe exhibits a targetoid
appearance in the arterial phase with central progressive enhancement in the portal venous and delayed phases, indicating a LR-M
observation. There are also features of tumor in vein (arrows), shown as portal vein expansion with heterogeneous contrast enhancement.
Biopsy results indicated a cholangiocarcinoma
How accurate is CT/MRI LI-RADS in differentiating iCCA from HCC?
The LI-RADS approach accurately assigns most non-HCC malignancies, including iCCA, to the LR-M
category [16-19] . It is important to note that unlike LR-5, the LR-M category is aimed at high sensitivity rather
than high specificity for non-HCC malignancies. Hence, it is not unexpected that some atypical HCCs
will be categorized as LR-M. In a systematic review and meta-analysis of 17 journal articles published by
[20]
van der Pol et al. , the vast majority (93%CI: 87%-97%) of lesions classified as LR-M were malignant
and about two thirds were non-HCC malignancies. In other words, about 1/3 of LR-M lesions were in
fact atypical HCC. Atypical HCC may represent cirrhotomimetic, sarcomatoid, macrotrabeular massive,
schirrhous or other variants that may show LR-M features [21-24] . Emerging data suggest that LR-M
categorization may provide prognostic information for HCC and cHCC-CCA tumors, with shorter disease
[25]
free progression and overall survival compared to tumors that are categorized as LR-5 . Figure 3 shows an
aggressive LR-M observation with signs of TIV.
CEUS
Imaging appearance
On CEUS, both iCCA and HCC often show APHE and washout. CEUS can detect APHE of liver
observations more sensitively than CT/MRI due to real-time assessment of arterial phase enhancement.
Therefore, earlier studies raised a concern for misdiagnosis of iCCA as HCC as both often show APHE and
washout . However, more recent studies have consistently demonstrated that CEUS reliably differentiates
[26]
iCCA from HCC if the pattern of APHE and the degree and timing of washout are considered [27-30] . On
CEUS, iCCAs commonly show rim APHE which is uncommon in HCC. Early washout within 60 s after
contrast injection and marked washout are consistently demonstrated in iCCA [31,32] . Very early washout
within the arterial phase time frame, which is frequently seen in iCCA on CEUS, may explain their frequent
[33]
arterial-phase hypoenhancing appearance on CT or MRI [Figure 4] . On the other hand, HCCs typically
show late (> 60 s after contrast injection) and mild washout [31,32] .
The LI-RADS approach on CEUS
The LI-RADS step-wise algorithmic approach on CEUS mirrors that of CT/MRI. Similar to CT/MRI, the
LR-M categorization is an early step in the process intended to identify malignant nodules that may not be
HCC. CEUS LR-M criteria include: rim-APHE, early (< 60 s) washout, or marked washout visible within
the first 120 s [Figures 4 and 5] [34,35] . The CEUS LI-RADS M criteria, like CT/MRI LR-M, reflect the imaging
appearance of iCCA on CEUS.
CEUS LR-M criteria differ from CT/MRI LR-M criteria mostly due to the different properties of the contrast
agents [33,36] . Figure 6 compares the criteria for LR-M and LR-5 between CT/MRI and CEUS. Microbubble