
Page 33 - Read Online
P. 33
Page 8 of 23 Shanmugasundaram et al. Energy Mater. 2025, 5, 500100 https://dx.doi.org/10.20517/energymater.2024.304
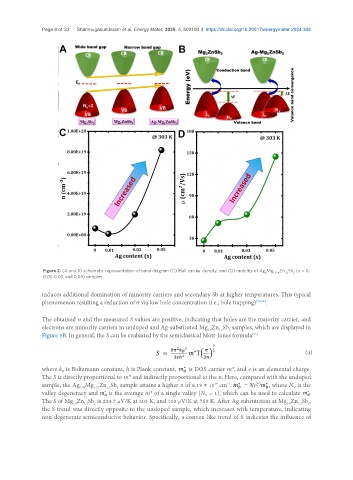
Figure 2. (A and B) schematic representation of band diagram (C) Hall carrier density, and (D) mobility of Ag Mg Zn Sb (x = 0,
x 1.8-x 1.2 2
0.01, 0.03, and 0.05) samples.
induces additional domination of minority carriers and secondary Sb at higher temperatures. This typical
phenomenon resulting a reduction of σ via low hole concentration (i.e., hole trapping) [53,54] .
The obtained n and the measured S values are positive, indicating that holes are the majority carrier, and
electrons are minority carriers in undoped and Ag-substituted Mg Zn Sb samples, which are displayed in
2
1.8
1.2
Figure 3B. In general, the S can be evaluated by the semiclassical Mott-Jones formula [55]
(4)
where k is Boltzmann constant, h is Plank constant, is DOS carrier m*, and e is an elemental charge.
B
The S is directly proportional to m* and indirectly proportional to the n. Here, compared with the undoped
19
sample, the Ag Mg Zn Sb sample attains a higher n of 8.19 × 10 cm . , where N is the
-3
2
V
1.2
1.75
0.05
valley degeneracy and is the average m* of a single valley (N = 1), which can be used to calculate .
V
The S of Mg Zn Sb is 234.7 µV/K at 303 K, and 103 µV/K at 753 K. After Ag substitution at Mg Zn Sb ,
1.8
1.2
1.2
2
1.8
2
the S trend was directly opposite to the undoped sample, which increases with temperature, indicating
non-degenerate semiconductor behavior. Specifically, a convex-like trend of S indicates the influence of