
Page 31 - Read Online
P. 31
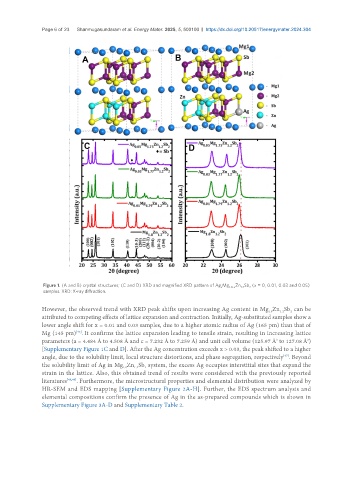
Page 6 of 23  Shanmugasundaram et al. Energy Mater. 2025, 5, 500100  https://dx.doi.org/10.20517/energymater.2024.304


                Figure 1. (A and B) crystal structures; (C and D) XRD and magnified XRD pattern of Ag Mg 1.8-x Zn Sb  (x = 0, 0.01, 0.03 and 0.05)
                                                                            x
                                                                                  1.2
                                                                                     2
                samples. XRD: X-ray diffraction.
               However, the observed trend with XRD peak shifts upon increasing Ag content in Mg Zn Sb  can be
                                                                                                   2
                                                                                               1.2
                                                                                            1.8
               attributed to competing effects of lattice expansion and contraction. Initially, Ag-substituted samples show a
               lower angle shift for x = 0.01 and 0.03 samples, due to a higher atomic radius of Ag (165 pm) than that of
               Mg (145 pm) . It confirms the lattice expansion leading to tensile strain, resulting in increasing lattice
                           [45]
               parameters (a = 4.484 Å to 4.508 Å and c = 7.232 Å to 7.259 Å) and unit cell volume (125.97 Å  to 127.08 Å )
                                                                                                         3
                                                                                              3
               [Supplementary Figure 1C and D]. After the Ag concentration exceeds x > 0.03, the peak shifted to a higher
               angle, due to the solubility limit, local structure distortions, and phase segregation, respectively . Beyond
                                                                                                 [47]
               the solubility limit of Ag in Mg Zn Sb  system, the excess Ag occupies interstitial sites that expand the
                                          1.8
                                              1.2
                                                  2
               strain in the lattice. Also, this obtained trend of results were considered with the previously reported
               literatures [48,49] . Furthermore, the microstructural properties and elemental distribution were analyzed by
               HR-SEM and EDS mapping [Supplementary Figure 2A-H]. Further, the EDS spectrum analysis and
               elemental compositions confirm the presence of Ag in the as-prepared compounds which is shown in
               Supplementary Figure 3A-D and Supplementary Table 2.