
Page 139 - Read Online
P. 139
Chen et al. Energy Mater. 2025, 5, 500120 https://dx.doi.org/10.20517/energymater.2024.311 Page 15 of 21
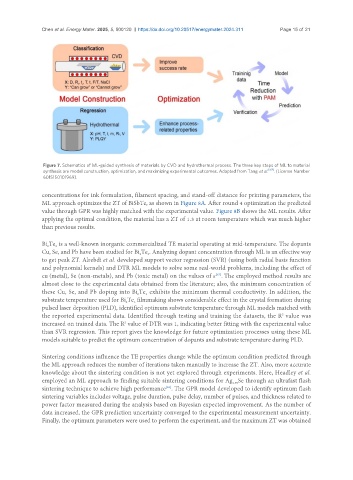
Figure 7. Schematics of ML-guided synthesis of materials by CVD and hydrothermal process. The three key steps of ML to material
synthesis are model construction, optimization, and maximizing experimental outcomes. Adapted from Tang et al. [59] . (License Number
6015150101969).
concentrations for ink formulation, filament spacing, and stand-off distance for printing parameters, the
ML approach optimizes the ZT of BiSbTe, as shown in Figure 8A. After round 4 optimization the predicted
value through GPR was highly matched with the experimental value. Figure 8B shows the ML results. After
applying the optimal condition, the material has a ZT of 1.3 at room temperature which was much higher
than previous results.
Bi Te is a well-known inorganic commercialized TE material operating at mid-temperature. The dopants
2
3
Cu, Se, and Pb have been studied for Bi Te . Analyzing dopant concentration through ML is an effective way
2
3
to get peak ZT. Alrebdi et al. developed support vector regression (SVR) (using both radial basis function
and polynomial kernels) and DTR ML models to solve some real-world problems, including the effect of
cu (metal), Se (non-metals), and Pb (toxic metal) on the values of κ . The employed method results are
[62]
almost close to the experimental data obtained from the literature; also, the minimum concentration of
these Cu, Se, and Pb doping into Bi Te exhibits the minimum thermal conductivity. In addition, the
3
2
substrate temperature used for Bi Te filmmaking shows considerable effect in the crystal formation during
2
3
pulsed laser deposition (PLD), identified optimum substrate temperature through ML models matched with
the reported experimental data. Identified through testing and training the datasets, the R value was
2
increased on trained data. The R value of DTR was 1, indicating better fitting with the experimental value
2
than SVR regression. This report gives the knowledge for future optimization processes using these ML
models suitable to predict the optimum concentration of dopants and substrate temperature during PLD.
Sintering conditions influence the TE properties change while the optimum condition predicted through
the ML approach reduces the number of iterations taken manually to increase the ZT. Also, more accurate
knowledge about the sintering condition is not yet explored through experiments. Here, Headley et al.
employed an ML approach to finding suitable sintering conditions for Ag Se through an ultrafast flash
1.96
sintering technique to achieve high performance . The GPR model developed to identify optimum flash
[63]
sintering variables includes voltage, pulse duration, pulse delay, number of pulses, and thickness related to
power factor measured during the analysis based on Bayesian expected improvement. As the number of
data increased, the GPR prediction uncertainty converged to the experimental measurement uncertainty.
Finally, the optimum parameters were used to perform the experiment, and the maximum ZT was obtained