
Page 185 - Read Online
P. 185
Page 10 of 14 Wang et al. Energy Mater 2023;3:300040 https://dx.doi.org/10.20517/energymater.2023.28
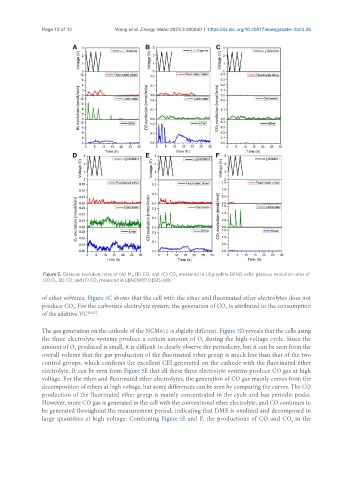
Figure 5. Gaseous evolution rates of (A) H , (B) CO, and (C) CO measured in Li||graphite DEMS cells; gaseous evolution rates of
2
2
(D) O , (E) CO, and (F) CO measured in Li||NCM811 DEMS cells.
2
2
of ether solvents. Figure 5C shows that the cell with the ether and fluorinated ether electrolytes does not
produce CO . For the carbonate electrolyte system, the generation of CO is attributed to the consumption
2
2
of the additive VC [26,27] .
The gas generation on the cathode of the NCM811 is slightly different. Figure 5D reveals that the cells using
the three electrolyte systems produce a certain amount of O during the high-voltage cycle. Since the
2
amount of O produced is small, it is difficult to clearly observe the periodicity, but it can be seen from the
2
overall volume that the gas production of the fluorinated ether group is much less than that of the two
control groups, which confirms the excellent CEI generated on the cathode with the fluorinated ether
electrolyte. It can be seen from Figure 5E that all these three electrolyte systems produce CO gas at high
voltage. For the ether and fluorinated ether electrolytes, the generation of CO gas mainly comes from the
decomposition of ethers at high voltage, but some differences can be seen by comparing the curves. The CO
production of the fluorinated ether group is mainly concentrated in the cycle and has periodic peaks.
However, more CO gas is generated in the cell with the conventional ether electrolyte, and CO continues to
be generated throughout the measurement period, indicating that DME is oxidized and decomposed in
large quantities at high voltage. Combining Figure 5E and F, the productions of CO and CO in the
2