
Page 130 - Read Online
P. 130
Shi et al. Energy Mater 2023;3:300036 https://dx.doi.org/10.20517/energymater.2023.27 Page 7 of 14
Table 1. Self-diffusion coefficients at different temperatures derived from PFG-NMR measurements and lithium transport numbers
calculated via Equation (1) for the PTFSI-10/5-70 electrolyte
2
-1
T (°C) D (10 m s ) D (10 m s ) t +
-10
2
-1
-10
F
Li
30 0.31 ± 0.01 No measurable diffusion 1
50 0.57 ± 0.02 No measurable diffusion 1
70 0.95 ± 0.03 No measurable diffusion 1
90 1.49 ± 0.04 No measurable diffusion 1
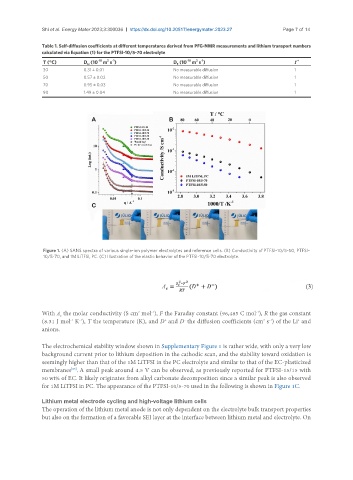
Figure 1. (A) SANS spectra of various single-ion polymer electrolytes and reference cells. (B) Conductivity of PTFSI-10/5-50, PTFSI-
10/5-70, and 1M LiTFSI, PC. (C) Illustration of the elastic behavior of the PTFSI-10/5-70 electrolyte.
With Ʌ the molar conductivity (S cm mol ), F the Faraday constant (96,485 C mol ), R the gas constant
-1
2
-1
e
(8.31 J mol K ), T the temperature (K), and D and D the diffusion coefficients (cm s ) of the Li and
-1
-
+
+
-1
2
-1
anions.
The electrochemical stability window shown in Supplementary Figure 1 is rather wide, with only a very low
background current prior to lithium deposition in the cathodic scan, and the stability toward oxidation is
seemingly higher than that of the 1M LiTFSI in the PC electrolyte and similar to that of the EC-plasticized
membranes . A small peak around 4.5 V can be observed, as previously reported for PTFSI-15/15 with
[25]
50 wt% of EC. It likely originates from alkyl carbonate decomposition since a similar peak is also observed
for 1M LiTFSI in PC. The appearance of the PTFSI-10/5-70 used in the following is shown in Figure 1C.
Lithium metal electrode cycling and high-voltage lithium cells
The operation of the lithium metal anode is not only dependent on the electrolyte bulk transport properties
but also on the formation of a favorable SEI layer at the interface between lithium metal and electrolyte. On