
Page 127 - Read Online
P. 127
Page 4 of 14 Shi et al. Energy Mater 2023;3:300036 https://dx.doi.org/10.20517/energymater.2023.27
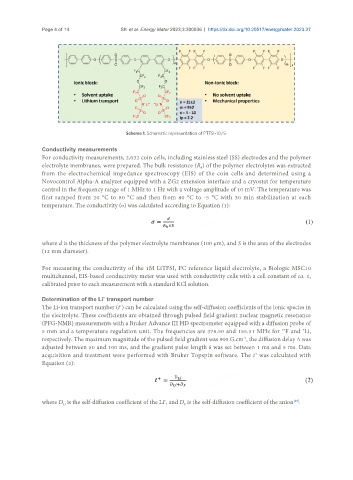
Scheme 1. Schematic representation of PTFSI-10/5.
Conductivity measurements
For conductivity measurements, 2,032 coin cells, including stainless steel (SS) electrodes and the polymer
electrolyte membranes, were prepared. The bulk resistance (R ) of the polymer electrolytes was extracted
b
from the electrochemical impedance spectroscopy (EIS) of the coin cells and determined using a
Novocontrol Alpha-A analyzer equipped with a ZG2 extension interface and a cryostat for temperature
control in the frequency range of 1 MHz to 1 Hz with a voltage amplitude of 10 mV. The temperature was
first ramped from 20 °C to 80 °C and then from 80 °C to -5 °C with 30 min stabilization at each
temperature. The conductivity (σ) was calculated according to Equation (1):
where d is the thickness of the polymer electrolyte membranes (100 µm), and S is the area of the electrodes
(12 mm diameter).
For measuring the conductivity of the 1M LiTFSI, PC reference liquid electrolyte, a Biologic MSC10
multichannel, EIS-based conductivity meter was used with conductivity cells with a cell constant of ca. 1,
calibrated prior to each measurement with a standard KCl solution.
+
Determination of the Li transport number
+
The Li-ion transport number (t ) can be calculated using the self-diffusion coefficients of the ionic species in
the electrolyte. These coefficients are obtained through pulsed field gradient nuclear magnetic resonance
(PFG-NMR) measurements with a Bruker Advance III HD spectrometer equipped with a diffusion probe of
7
5 mm and a temperature regulation unit. The frequencies are 376.50 and 155.51 MHz for F and Li,
19
respectively. The maximum magnitude of the pulsed field gradient was 900 G.cm , the diffusion delay Δ was
-1
adjusted between 50 and 100 ms, and the gradient pulse length δ was set between 1 ms and 5 ms. Data
acquisition and treatment were performed with Bruker Topspin software. The t was calculated with
+
Equation (2):
where D is the self-diffusion coefficient of the Li , and D is the self-diffusion coefficient of the anion .
[28]
+
Li
F