
Page 100 - Read Online
P. 100
Yang et al. Energy Mater 2023;3:300029 https://dx.doi.org/10.20517/energymater.2023.10 Page 7 of 18
-2 -2
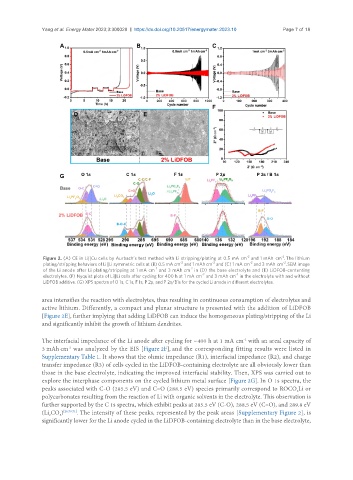
Figure 2. (A) CE in Li||Cu cells by Aurbach’s test method with Li stripping/plating at 0.5 mA cm and 1 mAh cm . The lithium
-2 -2 -2 -2
plating/stripping behaviors of Li||Li symmetric cells at (B) 0.5 mA cm and 1 mAh cm and (C) 1 mA cm and 3 mAh cm . SEM image
-2 -2
of the Li anode after Li plating/stripping at 1 mA cm and 3 mAh cm in (D) the base electrolyte and (E) LiDFOB-contenting
-2 -2
electrolytes. (F) Nyquist plots of Li||Li cells after cycling for 400 h at 1 mA cm and 3 mAh cm in the electrolyte with and without
LiDFOB additive. (G) XPS spectra of O 1s, C 1s, F 1s, P 2p, and P 2s/B1s for the cycled Li anode in different electrolytes.
area intensifies the reaction with electrolytes, thus resulting in continuous consumption of electrolytes and
active lithium. Differently, a compact and planar structure is presented with the addition of LiDFOB
[Figure 2E], further implying that adding LiDFOB can induce the homogeneous plating/stripping of the Li
and significantly inhibit the growth of lithium dendrites.
The interfacial impedance of the Li anode after cycling for ~400 h at 1 mA cm with an areal capacity of
-2
3 mAh cm was analyzed by the EIS [Figure 2F], and the corresponding fitting results were listed in
-2
Supplementary Table 1. It shows that the ohmic impedance (R1), interfacial impedance (R2), and charge
transfer impedance (R3) of cells cycled in the LiDFOB-containing electrolyte are all obviously lower than
those in the base electrolyte, indicating the improved interfacial stability. Then, XPS was carried out to
explore the interphase components on the cycled lithium metal surface [Figure 2G]. In O 1s spectra, the
peaks associated with C-O (285.5 eV) and C=O (288.5 eV) species primarily correspond to ROCO Li or
2
polycarbonates resulting from the reaction of Li with organic solvents in the electrolyte. This observation is
further supported by the C 1s spectra, which exhibit peaks at 285.5 eV (C-O), 288.5 eV (C=O), and 289.8 eV
(Li CO ) [26,70,71] . The intensity of these peaks, represented by the peak areas [Supplementary Figure 2], is
2
3
significantly lower for the Li anode cycled in the LiDFOB-containing electrolyte than in the base electrolyte,