
Page 147 - Read Online
P. 147
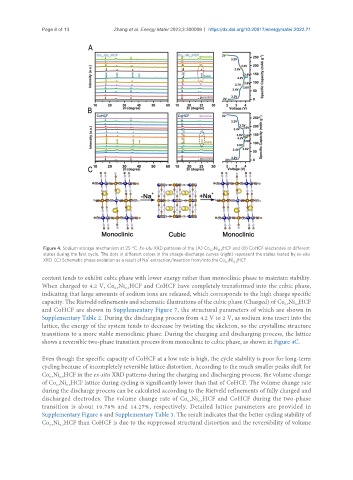
Page 8 of 13            Zhang et al. Energy Mater 2023;3:300008  https://dx.doi.org/10.20517/energymater.2022.71


                Figure 4. Sodium storage mechanism at 25 °C. Ex-situ XRD patterns of the (A) Co Ni HCF and (B) CoHCF electrodes at different
                                                                        0.7  0.3
                states during the first cycle. The dots in different colors in the charge-discharge curves (right) represent the states tested by ex-situ
                                                   +
                XRD. (C) Schematic phase evolution as a result of Na  extraction/insertion from/into the Co Ni HCF.
                                                                             0.7  0.3
               content tends to exhibit cubic phase with lower energy rather than monoclinic phase to maintain stability.
               When charged to 4.2 V, Co Ni HCF and CoHCF have completely transformed into the cubic phase,
                                        0.7
                                           0.3
               indicating that large amounts of sodium ions are released, which corresponds to the high charge specific
               capacity. The Rietveld refinements and schematic illustrations of the cubic phase (Charged) of Co Ni HCF
                                                                                                    0.3
                                                                                                 0.7
               and CoHCF are shown in Supplementary Figure 7, the structural parameters of which are shown in
               Supplementary Table 2. During the discharging process from 4.2 V to 2 V, as sodium ions insert into the
               lattice, the energy of the system tends to decrease by twisting the skeleton, so the crystalline structure
               transitions to a more stable monoclinic phase. During the charging and discharging process, the lattice
               shows a reversible two-phase transition process from monoclinic to cubic phase, as shown in Figure 4C.


               Even though the specific capacity of CoHCF at a low rate is high, the cycle stability is poor for long-term
               cycling because of incompletely reversible lattice distortion. According to the much smaller peaks shift for
               Co Ni HCF in the ex-situ XRD patterns during the charging and discharging process, the volume change
                     0.3
                  0.7
               of Co Ni HCF lattice during cycling is significantly lower than that of CoHCF. The volume change rate
                       0.3
                    0.7
               during the discharge process can be calculated according to the Rietveld refinements of fully charged and
               discharged electrodes. The volume change rate of Co Ni HCF and CoHCF during the two-phase
                                                                0.7
                                                                    0.3
               transition is about 10.78% and 14.27%, respectively. Detailed lattice parameters are provided in
               Supplementary Figure 8 and Supplementary Table 3. The result indicates that the better cycling stability of
               Co Ni HCF than CoHCF is due to the suppressed structural distortion and the reversibility of volume
                  0.7
                     0.3