Page 144 - Read Online
P. 144

Zhang et al. Energy Mater 2023;3:300008  https://dx.doi.org/10.20517/energymater.2022.71  Page 5 of 13


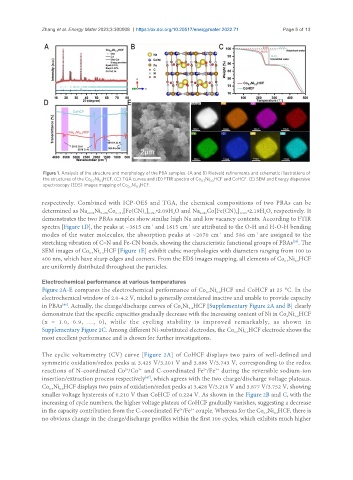
                Figure 1. Analysis of the structure and morphology of the PBA samples. (A and B) Rietveld refinements and schematic illustrations of
                the structures of the Co Ni HCF. (C) TGA curves and (D) FTIR spectra of Co Ni HCF and CoHCF. (E) SEM and Energy dispersive
                                0.7
                                                                        0.3
                                                                     0.7
                                  0.3
                spectroscopy (EDS) images mapping of Co Ni HCF.
                                            0.7
                                               0.3
               respectively. Combined with ICP-OES and TGA, the chemical compositions of two PBAs can be
               determined as Na Ni Co [Fe(CN) ]       •2.09H O and Na Co[Fe(CN) ]   •2.19H O, respectively. It
                              2.008
                                   0.269
                                        0.731
                                                                                 6 0.997
                                                                                          2
                                                                    2.047
                                                  6 0.997
                                                           2
               demonstrates the two PBAs samples show similar high Na and low vacancy contents. According to FTIR
               spectra [Figure 1D], the peaks at ~3615 cm  and 1615 cm  are attributed to the O-H and H-O-H bending
                                                                -1
                                                    -1
                                                                           -1
               modes of the water molecules, the absorption peaks at ~2070 cm  and 586 cm  are assigned to the
                                                                                       -1
                                                                                                    [28]
               stretching vibration of C≡N and Fe-CN bonds, showing the characteristic functional groups of PBAs . The
               SEM images of Co Ni HCF [Figure 1E] exhibit cubic morphologies with diameters ranging from 100 to
                                   0.3
                               0.7
               400 nm, which have sharp edges and corners. From the EDS images mapping, all elements of Co Ni HCF
                                                                                                    0.3
                                                                                                 0.7
               are uniformly distributed throughout the particles.
               Electrochemical performance at various temperatures
               Figure 2A-E compares the electrochemical performance of Co Ni HCF and CoHCF at 25 °C. In the
                                                                          0.3
                                                                      0.7
               electrochemical window of 2.0-4.2 V, nickel is generally considered inactive and unable to provide capacity
               in PBAs . Actually, the charge/discharge curves of Co Ni HCF [Supplementary Figure 2A and B] clearly
                      [46]
                                                              x
                                                                 1-x
               demonstrate that the specific capacities gradually decrease with the increasing content of Ni in Co Ni HCF
                                                                                                  x
                                                                                                    1-x
               (x  =  1.0,  0.9,  …,  0),  while  the  cycling  stability  is  improved  remarkably,  as  shown  in
               Supplementary Figure 2C. Among different Ni-substituted electrodes, the Co Ni HCF electrode shows the
                                                                                0.7
                                                                                   0.3
               most excellent performance and is chosen for further investigations.
               The cyclic voltammetry (CV) curve [Figure 2A] of CoHCF displays two pairs of well-defined and
               symmetric oxidation/redox peaks at 3.425 V/3.201 V and 3.886 V/3.743 V, corresponding to the redox
               reactions of N-coordinated Co /Co  and C-coordinated Fe /Fe  during the reversible sodium-ion
                                                                          3+
                                           2+
                                                                      2+
                                                3+
                                                  [47]
               insertion/extraction process respectively , which agrees with the two charge/discharge voltage plateaus.
               Co Ni HCF displays two pairs of oxidation/redox peaks at 3.428 V/3.218 V and 3.877 V/3.752 V, showing
                     0.3
                  0.7
               smaller voltage hysteresis of 0.210 V than CoHCF of 0.224 V. As shown in the Figure 2B and C, with the
               increasing of cycle numbers, the higher voltage plateau of CoHCF gradually vanishes, suggesting a decrease
               in the capacity contribution from the C-coordinated Fe /Fe  couple. Whereas for the Co Ni HCF, there is
                                                                 3+
                                                             2+
                                                                                             0.3
                                                                                          0.7
               no obvious change in the charge/discharge profiles within the first 100 cycles, which exhibits much higher
   139   140   141   142   143   144   145   146   147   148   149