
Page 70 - Read Online
P. 70
Page 14 of 20 Huang et al. Complex Eng Syst 2023;3:2 I http://dx.doi.org/10.20517/ces.2022.43
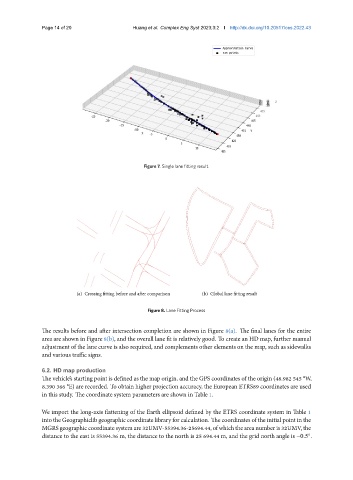
Figure 7. Single lane fitting result.
(a) Crossing fitting before and after comparison (b) Global lane fitting result
Figure 8. Lane Fitting Process
The results before and after intersection completion are shown in Figure 8(a). The final lanes for the entire
area are shown in Figure 8(b), and the overall lane fit is relatively good. To create an HD map, further manual
adjustment of the lane curve is also required, and complements other elements on the map, such as sidewalks
and various traffic signs.
6.2. HD map production
The vehicle’s starting point is defined as the map origin, and the GPS coordinates of the origin (48.982 545 °W,
8.390 366 °E) are recorded. To obtain higher projection accuracy, the European ETRS89 coordinates are used
in this study. The coordinate system parameters are shown in Table 1.
We import the long-axis flattening of the Earth ellipsoid defined by the ETRS coordinate system in Table 1
into the Geographiclib geographic coordinate library for calculation. The coordinates of the initial point in the
MGRSgeographiccoordinatesystemare32UMV-55394.36-25694.44, ofwhichtheareanumberis32UMV,the
distance to the east is 55394.36 m, the distance to the north is 25 694.44 m, and the grid north angle is −0.5 .
◦