


Page 32 - Read online
P. 32
Artyukhov et al. Carbon Footprints 2026, 5, 8                                     Page 9 of 21


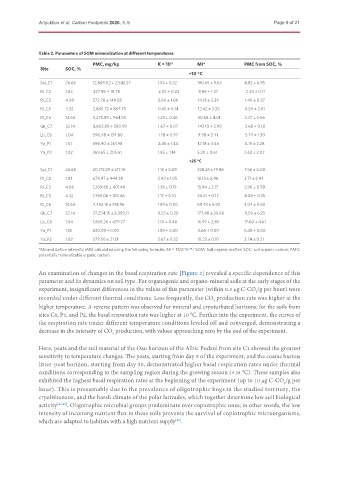
               Table 2. Parameters of SOM mineralization at different temperatures
                                  PMC, mg/kg            K × 10 -2     MI*              PMC from SOC, %
               Site     SOC, %
                                                                   +10 °C
               Sal_C1   26.68     12,849.02 ± 2,542.37  1.53 ± 0.32   190.65 ± 5.63    4.82 ± 0.95
               RI_C2    1.83      427.85 ± 19.78         2.02 ± 0.23   8.65 ± 1.37     2.34 ± 0.11
               RI_C3    4.08      572.76 ± 149.58        2.60 ± 1.06  14.18 ± 5.39     1.40 ± 0.37
               RI_C5    4.32      2,845.72 ± 867.75      0.45 ± 0.14   12.42 ± 3.25    6.59 ± 2.01
               RI_C6    14.64     3,475.89 ± 964.55     1.25 ± 0.46   40.68 ± 4.01     2.37 ± 0.66
               Gk_C7    32.14     8,603.89 ± 580.99      1.67 ± 0.07  143.10 ± 3.90    2.68 ± 0.18
               Lb_C8    1.04      596.48 ± 134.80        1.78 ± 0.97   9.98 ± 3.41     5.74 ± 1.30
               Ya_P1    1.51      596.90 ± 261.98        2.46 ± 1.44   12.18 ± 3.46    5.19 ± 2.28
               Ya_P2    1.02      369.65 ± 205.61       1.85 ± 1.14   5.30 ± 0.61      3.62 ± 2.02
                                                                   +25 °C
               Sal_C1   26.68     20,173.39 ± 217.16    1.13 ± 0.09   228.25 ± 19.86   7.56 ± 0.08
               RI_C2    1.83      678.97 ± 444.38       2.42 ± 1.95   12.13 ± 2.46     3.71 ± 2.43
               RI_C3    4.08      1,209.66 ± 401.48     1.36 ± 0.19   15.94 ± 3.17     2.96 ± 0.98
               RI_C5    4.32      1,765.06 ± 150.46     1.17 ± 0.10   20.61 ± 0.17     4.08 ± 0.35
               RI_C6    14.64     4,452.15 ± 918.96     1.59 ± 0.20   69.43 ± 6.92     3.04 ± 0.63
               Gk_C7    32.14     37,254.15 ± 2,093.11  0.53 ± 0.20   177.48 ± 30.66   11.59 ± 6.25
               Lb_C8    1.04      1,830.26 ± 479.77     1.01 ± 0.48   16.97 ± 2.80     17.60 ± 4.61
               Ya_P1    1.51      630.09 ± 0.00         1.85 ± 0.00   11.65 ± 0.00     5.48 ± 0.00
               Ya_P2    1.02      279.50 ± 21.51        3.67 ± 0.32   10.23 ± 0.10     2.74 ± 0.21
               *Mineralization intensity (MI) calculated using the following formula: IM = PMC*k [48] . SOM: Soil organic matter; SOC: soil organic carbon; PMC:
               potentially mineralizable organic carbon.


               An examination of changes in the basal respiration rate [Figure 3] revealed a specific dependence of this
               parameter and its dynamics on soil type. For organogenic and organo-mineral soils at the early stages of the
               experiment, insignificant differences in the values of this parameter (within 0.5 µg C-CO /g per hour) were
                                                                                           2
               recorded under different thermal conditions. Less frequently, the CO  production rate was higher at the
                                                                            2
               higher temperature. A reverse pattern was observed for mineral and cryoturbated horizons: for the soils from
               sites C8, P1, and P2, the basal respiration rate was higher at 10 °C. Further into the experiment, the curves of
               the respiration rate under different temperature conditions leveled off and converged, demonstrating a
               decrease in the intensity of CO  production, with values approaching zero by the end of the experiment.
                                         2

               Here, peats and the soil material of the Oao horizon of the Albic Podzol from site C1 showed the greatest
               sensitivity to temperature changes. The peats, starting from day 5 of the experiment, and the coarse humus
               litter-peat horizon, starting from day 30, demonstrated higher basal respiration rates under thermal
               conditions corresponding to the sampling region during the growing season (+10 °C). These samples also
               exhibited the highest basal respiration rates at the beginning of the experiment (up to 10 µg C-CO /g per
                                                                                                     2
               hour). This is presumably due to the prevalence of oligotrophic bogs in the studied territory, the
               cryolithozone, and the harsh climate of the polar latitudes, which together determine low soil biological
               activity [47,48] . Oligotrophic microbial groups predominate over copiotrophic ones; in other words, the low
               intensity of incoming nutrient flux in these soils prevents the survival of copiotrophic microorganisms,
               which are adapted to habitats with a high nutrient supply .
                                                               [49]

