


Page 28 - Read online
P. 28
Artyukhov et al. Carbon Footprints 2026, 5, 8                                     Page 5 of 21


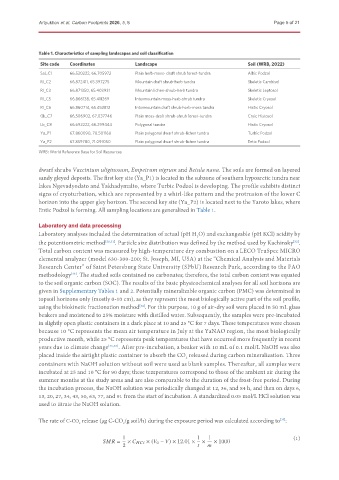
               Table 1. Characteristics of sampling landscapes and soil classification
               Site code  Coordinates            Landscape                              Soil (WRB, 2022)

               Sal_C1     66.530222, 66.705972   Plain herb-moss- draft shrub forest-tundra  Albic Podzol
               RI_C2      66.872411, 65.397275   Mountain draft shrub-herb tundra       Skeletic Cambisol
               RI_C3      66.871350, 65.403931   Mountain lichen-shrub-herb tundra      Skeletic Leptosol
               RI_C5      66.866138, 65.411269   Intermountain moss-herb-shrub tundra   Skeletic Cryosol
               RI_C6      66.860714, 65.452812   Intermountain draft shrub-herb-moss tundra  Histic Cryosol
               Gk_C7      66.506902, 67.037746   Plain moss-draft shrub-shrub forest-tundra  Cryic Histosol
               Lb_C8      66.692222, 66.299444   Polygonal tundra                       Histic Cryosol
               Ya_P1      67.860090, 70.501160   Plain polygonal dwarf shrub-lichen tundra  Turbic Podzol
               Ya_P2      67.859780, 71.091050   Plain polygonal dwarf shrub-lichen tundra  Entic Podzol

               WRB: World Reference Base for Soil Resources

               dwarf shrubs Vaccinium uliginosum, Empetrum nigrum and Betula nana. The soils are formed on layered
               sandy gleyed deposits. The first key site (Ya_P1) is located in the subzone of southern hypoarctic tundra near
               lakes Ngevadyodato and Yakhadymalto, where Turbic Podzol is developing. The profile exhibits distinct
               signs of cryoturbation, which are represented by a whirl-like pattern and the protrusion of the lower C
               horizon into the upper gley horizon. The second key site (Ya_P2) is located next to the Yaroto lakes, where
               Entic Podzol is forming. All sampling locations are generalized in Table 1.


               Laboratory and data processing
               Laboratory analyses included the determination of actual (pH H O) and exchangeable (pH KCl) acidity by
                                                                      2
               the potentiometric method [30,31] . Particle size distribution was defined by the method used by Kachinsky .
                                                                                                        [32]
               Total carbon content was measured by high-temperature dry combustion on a LECO TruSpec MICRO
               elemental analyzer (model 630-300-200; St. Joseph, MI, USA) at the “Chemical Analysis and Materials
               Research Center” of Saint Petersburg State University (SPbU) Research Park, according to the FAO
               methodology . The studied soils contained no carbonates; therefore, the total carbon content was equated
                          [33]
               to the soil organic carbon (SOC). The results of the basic physicochemical analyses for all soil horizons are
               given in Supplementary Tables 1 and 2. Potentially mineralizable organic carbon (PMC) was determined in
               topsoil horizons only (mostly 0-10 cm), as they represent the most biologically active part of the soil profile,
               using the biokinetic fractionation method . For this purpose, 10 g of air-dry soil were placed in 50 mL glass
                                                  [34]
               beakers and moistened to 25% moisture with distilled water. Subsequently, the samples were pre-incubated
               in slightly open plastic containers in a dark place at 10 and 25 °C for 7 days. These temperatures were chosen
               because 10 °C represents the mean air temperature in July at the YaNAO region, the most biologically
               productive month, while 25 °C represents peak temperatures that have occurred more frequently in recent
               years due to climate change [35,36] . After pre-incubation, a beaker with 10 mL of 0.1 mol/L NaOH was also
               placed inside the airtight plastic container to absorb the CO  released during carbon mineralization. Three
                                                                  2
               containers with NaOH solution without soil were used as blank samples. Thereafter, all samples were
               incubated at 25 and 10 °C for 90 days; these temperatures correspond to those of the ambient air during the
               summer months at the study areas and are also comparable to the duration of the frost-free period. During
               the incubation process, the NaOH solution was periodically changed at 12, 36, and 84 h, and then on days 6,
               13, 20, 27, 34, 43, 50, 63, 77, and 91 from the start of incubation. A standardized 0.05 mol/L HCl solution was
               used to titrate the NaOH solution.

               The rate of С-СО  release (μg C-CO /g soil/h) during the exposure period was calculated according to :
                                                                                                   [37]
                             2
                                            2
                                            1                         1   1                             (1)
                                            =  ×           × (   0 −   ) × 12.01 ×  ×  × 1000
2 

