


Page 31 - Read online
P. 31
Page 8 of 21                                               Artyukhov et al. Carbon Footprints 2026, 5, 8


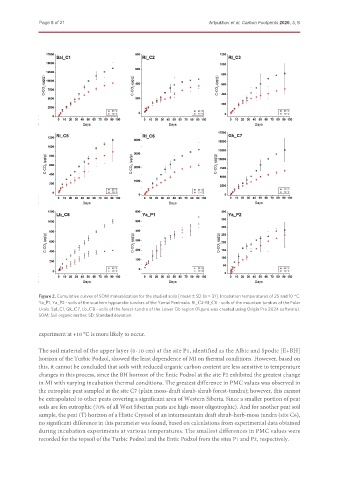
               Figure 2. Cumulative curves of SOM mineralization for the studied soils [mean ± SD (n = 3)]. Incubation temperatures of 25 and 10 °C.
               Ya_Р1, Ya_Р2 - soils of the southern hypoarctic tundras of the Yamal Peninsula. RI_С2-RI_С6 - soils of the mountain tundras of the Polar
               Urals. Sal_C1, Gk_С7, Lb_С8 - soils of the forest-tundra of the Lower Ob region (Figure was created using Origin Pro 2024 software).
               SOM: Soil organic matter; SD: Standard deviation.


               experiment at +10 °C is more likely to occur.


               The soil material of the upper layer (0-10 cm) at the site P1, identified as the Albic and Spodic [E+BH]
               horizon of the Turbic Podzol, showed the least dependence of MI on thermal conditions. However, based on
               this, it cannot be concluded that soils with reduced organic carbon content are less sensitive to temperature
               changes in this process, since the BH horizon of the Entic Podzol at the site P2 exhibited the greatest change
               in MI with varying incubation thermal conditions. The greatest difference in PMC values was observed in
               the eutrophic peat sampled at the site C7 (plain moss-draft shrub-shrub forest-tundra); however, this cannot
               be extrapolated to other peats covering a significant area of Western Siberia. Since a smaller portion of peat
               soils are fen eutrophic (70% of all West Siberian peats are high-moor oligotrophic). And for another peat soil
               sample, the peat (T) horizon of a Histic Cryosol of an intermountain draft shrub-herb-moss tundra (site C6),
               no significant difference in this parameter was found, based on calculations from experimental data obtained
               during incubation experiments at various temperatures. The smallest differences in PMC values were
               recorded for the topsoil of the Turbic Podzol and the Entic Podzol from the sites P1 and P2, respectively.

