


Page 34 - Read online
P. 34
Artyukhov et al. Carbon Footprints 2026, 5, 8                                    Page 11 of 21


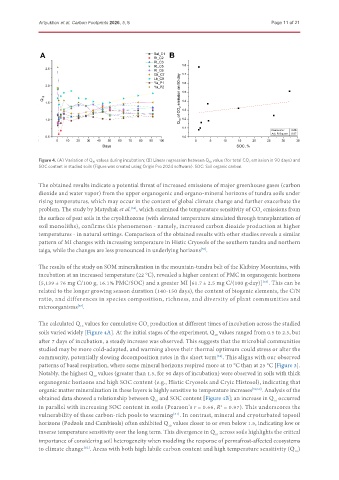
               Figure 4. (A) Variation of Q 10  values during incubation; (B) Linear regression between Q 10  value (for total CO 2  emission in 90 days) and
               SOC content in studied soils (Figure was created using Origin Pro 2024 software). SOC: Soil organic carbon.


               The obtained results indicate a potential threat of increased emissions of major greenhouse gases (carbon
               dioxide and water vapor) from the upper organogenic and organo-mineral horizons of tundra soils under
               rising temperatures, which may occur in the context of global climate change and further exacerbate the
               problem. The study by Matyshak et al. , which examined the temperature sensitivity of CO  emissions from
                                               [54]
                                                                                            2
               the surface of peat soils in the cryolithozone (with elevated temperature simulated through transplantation of
               soil monoliths), confirms this phenomenon - namely, increased carbon dioxide production at higher
               temperatures - in natural settings. Comparison of the obtained results with other studies reveals a similar
               pattern of MI changes with increasing temperature in Histic Cryosols of the southern tundra and northern
               taiga, while the changes are less pronounced in underlying horizons .
                                                                        [55]
               The results of the study on SOM mineralization in the mountain-tundra belt of the Khibiny Mountains, with
               incubation at an increased temperature (22 °C), revealed a higher content of PMC in organogenic horizons
               (5,139 ± 76 mg C/100 g, 16.1% PMC/SOC) and a greater MI [61.7 ± 2.5 mg C/(100 g·day)] . This can be
                                                                                             [56]
               related to the longer growing season duration (140-150 days), the content of biogenic elements, the C/N
               ratio, and differences in species composition, richness, and diversity of plant communities and
               microorganisms .
                            [57]

               The calculated Q  values for cumulative CO  production at different times of incubation across the studied
                                                     2
                             10
               soils varied widely [Figure 4A]. At the initial stages of the experiment, Q  values ranged from 0.5 to 2.5, but
                                                                            10
               after 7 days of incubation, a steady increase was observed. This suggests that the microbial communities
               studied may be more cold-adapted, and warming above their thermal optimum could stress or alter the
               community, potentially slowing decomposition rates in the short term . This aligns with our observed
                                                                             [58]
               patterns of basal respiration, where some mineral horizons respired more at 10 °C than at 25 °C [Figure 3].
               Notably, the highest Q  values (greater than 1.5, for 90 days of incubation) were observed in soils with thick
                                  10
               organogenic horizons and high SOC content (e.g., Histic Cryosols and Cryic Histosol), indicating that
               organic matter mineralization in these layers is highly sensitive to temperature increases [59,60] . Analysis of the
               obtained data showed a relationship between Q  and SOC content [Figure 4B]; an increase in Q  occurred
                                                       10
                                                                                                 10
               in parallel with increasing SOC content in soils (Pearson’s r = 0.66, R  = 0.97). This underscores the
                                                                              2
               vulnerability of these carbon-rich pools to warming . In contrast, mineral and cryoturbated topsoil
                                                              [61]
               horizons (Podzols and Cambisols) often exhibited Q  values closer to or even below 1.5, indicating low or
                                                            10
               inverse temperature sensitivity over the long term. This divergence in Q  across soils highlights the critical
                                                                            10
               importance of considering soil heterogeneity when modeling the response of permafrost-affected ecosystems
               to climate change . Areas with both high labile carbon content and high temperature sensitivity (Q )
                              [62]
                                                                                                         10

