


Page 58 - Read Online
P. 58
Page 10 of 19                    Wang et al. Carbon Footprints 2024;3:14  https://dx.doi.org/10.20517/cf.2024.19


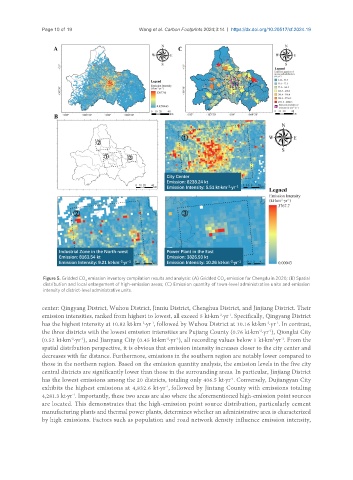
                Figure 5. Gridded CO  emission inventory compilation results and analysis: (A) Gridded CO  emission for Chengdu in 2020; (B) Spatial
                              2
                                                                             2
                distribution and local enlargement of high-emission areas; (C) Emission quantity of town-level administrative units and emission
                intensity of district-level administrative units.
               center: Qingyang District, Wuhou District, Jinniu District, Chenghua District, and Jinjiang District. Their
               emission intensities, ranked from highest to lowest, all exceed 5 kt·km ·yr . Specifically, Qingyang District
                                                                              -1
                                                                           -2
                                                 -2
                                                    -1
               has the highest intensity at 10.82 kt·km ·yr , followed by Wuhou District at 10.16 kt·km ·yr . In contrast,
                                                                                              -1
                                                                                           -2
               the three districts with the lowest emission intensities are Pujiang County (0.76 kt·km ·yr ), Qionglai City
                                                                                            -1
                                                                                        -2
                                                                                             2
                                                                                                -1
                                                         -2
                                                            -1
                         -2
               (0.52 kt·km ·yr ), and Jianyang City (0.45 kt·km ·yr ), all recording values below 1 kt·km ·yr . From the
                            -1
               spatial distribution perspective, it is obvious that emission intensity increases closer to the city center and
               decreases with far distance. Furthermore, emissions in the southern region are notably lower compared to
               those in the northern region. Based on the emission quantity analysis, the emission levels in the five city
               central districts are significantly lower than those in the surrounding areas. In particular, Jinjiang District
                                                                               -1
               has the lowest emissions among the 20 districts, totaling only 406.5 kt·yr . Conversely, Dujiangyan City
               exhibits the highest emissions at 4,832.6 kt·yr , followed by Jintang County with emissions totaling
                                                         -1
                         -1
               4,281.3 kt·yr . Importantly, these two areas are also where the aforementioned high-emission point sources
               are located. This demonstrates that the high-emission point source distribution, particularly cement
               manufacturing plants and thermal power plants, determines whether an administrative area is characterized
               by high emissions. Factors such as population and road network density influence emission intensity,

