


Page 56 - Read Online
P. 56
Page 8 of 19                     Wang et al. Carbon Footprints 2024;3:14  https://dx.doi.org/10.20517/cf.2024.19


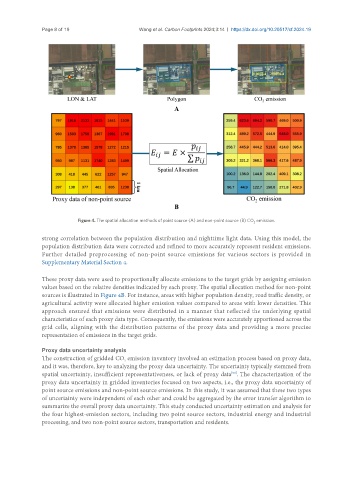
                           Figure 4. The spatial allocation methods of point source (A) and non-point source (B) CO  emission.
                                                                                       2
               strong correlation between the population distribution and nighttime light data. Using this model, the
               population distribution data were corrected and refined to more accurately represent resident emissions.
               Further detailed preprocessing of non-point source emissions for various sectors is provided in
               Supplementary Material Section 4.


               These proxy data were used to proportionally allocate emissions to the target grids by assigning emission
               values based on the relative densities indicated by each proxy. The spatial allocation method for non-point
               sources is illustrated in Figure 4B. For instance, areas with higher population density, road traffic density, or
               agricultural activity were allocated higher emission values compared to areas with lower densities. This
               approach ensured that emissions were distributed in a manner that reflected the underlying spatial
               characteristics of each proxy data type. Consequently, the emissions were accurately apportioned across the
               grid cells, aligning with the distribution patterns of the proxy data and providing a more precise
               representation of emissions in the target grids.

               Proxy data uncertainty analysis
               The construction of gridded CO  emission inventory involved an estimation process based on proxy data,
                                           2
               and it was, therefore, key to analyzing the proxy data uncertainty. The uncertainty typically stemmed from
               spatial uncertainty, insufficient representativeness, or lack of proxy data . The characterization of the
                                                                               [50]
               proxy data uncertainty in gridded inventories focused on two aspects, i.e., the proxy data uncertainty of
               point source emissions and non-point source emissions. In this study, it was assumed that these two types
               of uncertainty were independent of each other and could be aggregated by the error transfer algorithm to
               summarize the overall proxy data uncertainty. This study conducted uncertainty estimation and analysis for
               the four highest-emission sectors, including two point source sectors, industrial energy and industrial
               processing, and two non-point source sectors, transportation and residents.

