


Page 61 - Read Online
P. 61
Wang et al. Carbon Footprints 2024;3:14  https://dx.doi.org/10.20517/cf.2024.19  Page 13 of 19


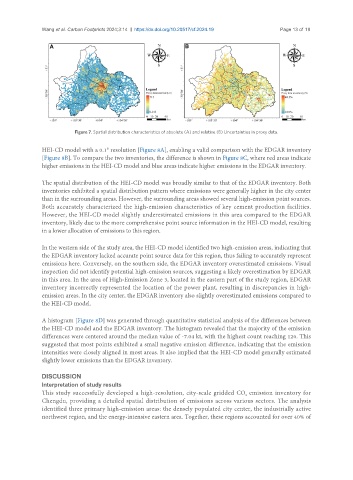
                          Figure 7. Spatial distribution characteristics of absolute (A) and relative (B) Uncertainties in proxy data.


               HEI-CD model with a 0.1° resolution [Figure 8A], enabling a valid comparison with the EDGAR inventory
               [Figure 8B]. To compare the two inventories, the difference is shown in Figure 8C, where red areas indicate
               higher emissions in the HEI-CD model and blue areas indicate higher emissions in the EDGAR inventory.


               The spatial distribution of the HEI-CD model was broadly similar to that of the EDGAR inventory. Both
               inventories exhibited a spatial distribution pattern where emissions were generally higher in the city center
               than in the surrounding areas. However, the surrounding areas showed several high-emission point sources.
               Both accurately characterized the high-emission characteristics of key cement production facilities.
               However, the HEI-CD model slightly underestimated emissions in this area compared to the EDGAR
               inventory, likely due to the more comprehensive point source information in the HEI-CD model, resulting
               in a lower allocation of emissions to this region.

               In the western side of the study area, the HEI-CD model identified two high-emission areas, indicating that
               the EDGAR inventory lacked accurate point source data for this region, thus failing to accurately represent
               emissions here. Conversely, on the southern side, the EDGAR inventory overestimated emissions. Visual
               inspection did not identify potential high-emission sources, suggesting a likely overestimation by EDGAR
               in this area. In the area of High-Emission Zone 3, located in the eastern part of the study region, EDGAR
               inventory incorrectly represented the location of the power plant, resulting in discrepancies in high-
               emission areas. In the city center, the EDGAR inventory also slightly overestimated emissions compared to
               the HEI-CD model.


               A histogram [Figure 8D] was generated through quantitative statistical analysis of the differences between
               the HEI-CD model and the EDGAR inventory. The histogram revealed that the majority of the emission
               differences were centered around the median value of -7.04 kt, with the highest count reaching 120. This
               suggested that most points exhibited a small negative emission difference, indicating that the emission
               intensities were closely aligned in most areas. It also implied that the HEI-CD model generally estimated
               slightly lower emissions than the EDGAR inventory.


               DISCUSSION
               Interpretation of study results
               This study successfully developed a high-resolution, city-scale gridded CO  emission inventory for
                                                                                    2
               Chengdu, providing a detailed spatial distribution of emissions across various sectors. The analysis
               identified three primary high-emission areas: the densely populated city center, the industrially active
               northwest region, and the energy-intensive eastern area. Together, these regions accounted for over 40% of

