


Page 60 - Read Online
P. 60
Page 12 of 19                    Wang et al. Carbon Footprints 2024;3:14  https://dx.doi.org/10.20517/cf.2024.19


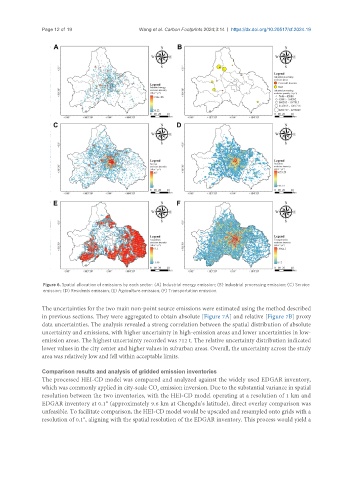
                Figure 6. Spatial allocation of emissions by each sector: (A) Industrial energy emission; (B) Industrial processing emission; (C) Service
                emission; (D) Residents emission; (E) Agriculture emission; (F) Transportation emission.

               The uncertainties for the two main non-point source emissions were estimated using the method described
               in previous sections. They were aggregated to obtain absolute [Figure 7A] and relative [Figure 7B] proxy
               data uncertainties. The analysis revealed a strong correlation between the spatial distribution of absolute
               uncertainty and emissions, with higher uncertainty in high-emission areas and lower uncertainties in low-
               emission areas. The highest uncertainty recorded was 712 t. The relative uncertainty distribution indicated
               lower values in the city center and higher values in suburban areas. Overall, the uncertainty across the study
               area was relatively low and fell within acceptable limits.


               Comparison results and analysis of gridded emission inventories
               The processed HEI-CD model was compared and analyzed against the widely used EDGAR inventory,
               which was commonly applied in city-scale CO  emission inversion. Due to the substantial variance in spatial
                                                      2
               resolution between the two inventories, with the HEI-CD model operating at a resolution of 1 km and
               EDGAR inventory at 0.1° (approximately 9.6 km at Chengdu’s latitude), direct overlay comparison was
               unfeasible. To facilitate comparison, the HEI-CD model would be upscaled and resampled onto grids with a
               resolution of 0.1°, aligning with the spatial resolution of the EDGAR inventory. This process would yield a

