


Page 54 - Read Online
P. 54
Page 6 of 19                     Wang et al. Carbon Footprints 2024;3:14  https://dx.doi.org/10.20517/cf.2024.19


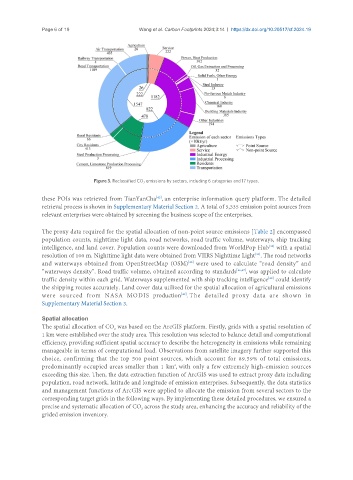
                                 Figure 3. Reclassified CO  emissions by sectors, including 6 categories and 17 types.
                                                 2
                                                      [42]
               these POIs was retrieved from TianYanCha , an enterprise information query platform. The detailed
               retrieval process is shown in Supplementary Material Section 2. A total of 5,335 emission point sources from
               relevant enterprises were obtained by screening the business scope of the enterprises.


               The proxy data required for the spatial allocation of non-point source emissions [Table 2] encompassed
               population counts, nighttime light data, road networks, road traffic volume, waterways, ship tracking
                                                                                            [43]
               intelligence, and land cover. Population counts were downloaded from WorldPop Hub  with a spatial
               resolution of 100 m. Nighttime light data were obtained from VIIRS Nighttime Light . The road networks
                                                                                       [44]
                                                                [45]
               and waterways obtained from OpenStreetMap (OSM)  were used to calculate “road density” and
               “waterways density”. Road traffic volume, obtained according to standards [46,47] , was applied to calculate
                                                                                           [48]
               traffic density within each grid. Waterways supplemented with ship tracking intelligence  could identify
               the shipping routes accurately. Land cover data utilized for the spatial allocation of agricultural emissions
                                                              [49]
               were  sourced  from  NASA  MODIS  production . The  detailed  proxy  data  are  shown  in
               Supplementary Material Section 3.

               Spatial allocation
               The spatial allocation of CO  was based on the ArcGIS platform. Firstly, grids with a spatial resolution of
                                       2
               1 km were established over the study area. This resolution was selected to balance detail and computational
               efficiency, providing sufficient spatial accuracy to describe the heterogeneity in emissions while remaining
               manageable in terms of computational load. Observations from satellite imagery further supported this
               choice, confirming that the top 500 point sources, which account for 89.59% of total emissions,
               predominantly occupied areas smaller than 1 km , with only a few extremely high-emission sources
                                                            2
               exceeding this size. Then, the data extraction function of ArcGIS was used to extract proxy data including
               population, road network, latitude and longitude of emission enterprises. Subsequently, the data statistics
               and management functions of ArcGIS were applied to allocate the emission from several sectors to the
               corresponding target grids in the following ways. By implementing these detailed procedures, we ensured a
               precise and systematic allocation of CO  across the study area, enhancing the accuracy and reliability of the
                                                 2
               grided emission inventory.

