


Page 53 - Read Online
P. 53
Wang et al. Carbon Footprints 2024;3:14  https://dx.doi.org/10.20517/cf.2024.19  Page 5 of 19

               Table 1. CO  emission source classification and the proxy data for spatial allocation
                       2
                     CO  emission source
                       2
                Category  Type           Emission type Proxy data
                Industry  Industrial energy  Point sources  Latitude and longitude coordinates of emitting enterprise and service POI,
                                                     enterprise size, etc.
                          Industrial processing
                Service   -
                Residential  -           Non-point   Population distribution data
                                         sources
                Agriculture  -                       Land cover data
                Transportation  Road transportion    Traffic network and rated traffic volume at all road levels
                          Waterborne                 Water distribution and ship routes
                          transportion


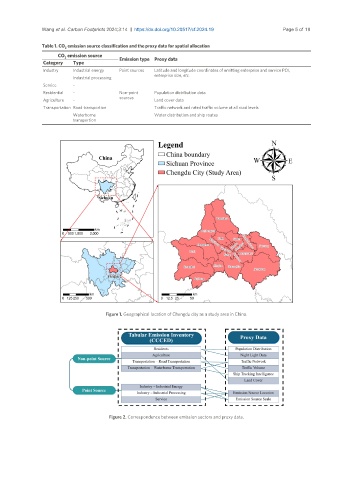
                                     Figure 1. Geographical location of Chengdu city as a study area in China.


                                      Figure 2. Correspondence between emission sectors and proxy data.

