


Page 11 - Read Online
P. 11
Li et al. Carbon Footprints 2024;3:6  https://dx.doi.org/10.20517/cf.2023.54     Page 7 of 14


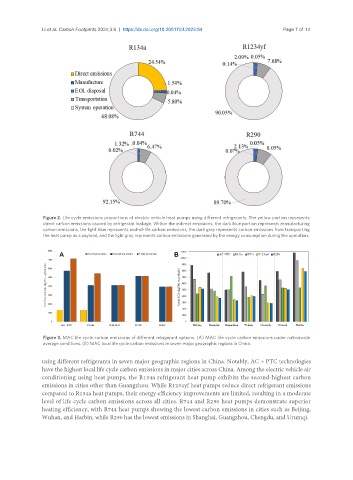
                Figure 2. Life cycle emissions proportions of electric vehicle heat pumps using different refrigerants. The yellow portion represents
                direct carbon emissions caused by refrigerant leakage. Within the indirect emissions, the dark blue portion represents manufacturing
                carbon emissions, the light blue represents end-of-life carbon emissions, the dark gray represents carbon emissions from transporting
                the heat pump as a payload, and the light gray represents carbon emissions generated by the energy consumption during the operation.


                Figure 3. MAC life cycle carbon emissions of different refrigerant options. (A) MAC life cycle carbon emissions under nationwide
                average conditions. (B) MAC local life cycle carbon emissions in seven major geographic regions in China.

               using different refrigerants in seven major geographic regions in China. Notably, AC + PTC technologies
               have the highest local life cycle carbon emissions in major cities across China. Among the electric vehicle air
               conditioning using heat pumps, the R134a refrigerant heat pump exhibits the second-highest carbon
               emissions in cities other than Guangzhou. While R1234yf heat pumps reduce direct refrigerant emissions
               compared to R134a heat pumps, their energy efficiency improvements are limited, resulting in a moderate
               level of life cycle carbon emissions across all cities. R744 and R290 heat pumps demonstrate superior
               heating efficiency, with R744 heat pumps showing the lowest carbon emissions in cities such as Beijing,
               Wuhan, and Harbin, while R290 has the lowest emissions in Shanghai, Guangzhou, Chengdu, and Urumqi.

