
Page 53 - Read Online
P. 53
Han et al. Cancer Drug Resist 2024;7:16 https://dx.doi.org/10.20517/cdr.2024.01 Page 15 of 25
**
***
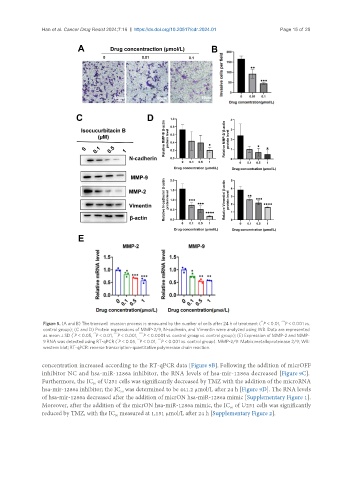
Figure 5. (A and B) The transwell invasion process is measured by the number of cells after 24 h of treatment ( P < 0.01, P < 0.001 vs.
control group); (C and D) Protein expressions of MMP-2/9, N-cadherin, and Vimentin were analyzed using WB. Data are represented
* ** *** ****
as mean ± SD ( P < 0.05, P < 0.01, P < 0.001, P < 0.0001 vs. control group vs. control group); (E) Expression of MMP-2 and MMP-
* ** ***
9 RNA was detected using RT-qPCR ( P < 0.05, P < 0.01, P < 0.001 vs. control group). MMP-2/9: Matrix metalloproteinase 2/9; WB:
western blot; RT-qPCR: reverse transcription-quantitative polymerase chain reaction.
concentration increased according to the RT-qPCR data [Figure 9B]. Following the addition of micrOFF
inhibitor NC and hsa-miR-1286a inhibitor, the RNA levels of hsa-mir-1286a decreased [Figure 9C].
Furthermore, the IC of U251 cells was significantly decreased by TMZ with the addition of the microRNA
50
hsa-mir-1286a inhibitor; the IC was determined to be 441.2 µmol/L after 24 h [Figure 9D]. The RNA levels
50
of hsa-mir-1286a decreased after the addition of micrON hsa-miR-1286a mimic [Supplementary Figure 1].
Moreover, after the addition of the micrON hsa-miR-1286a mimic, the IC of U251 cells was significantly
50
reduced by TMZ, with the IC measured at 1,151 µmol/L after 24 h [Supplementary Figure 2].
50