
Page 54 - Read Online
P. 54
Page 16 of 25 Han et al. Cancer Drug Resist 2024;7:16 https://dx.doi.org/10.20517/cdr.2024.01
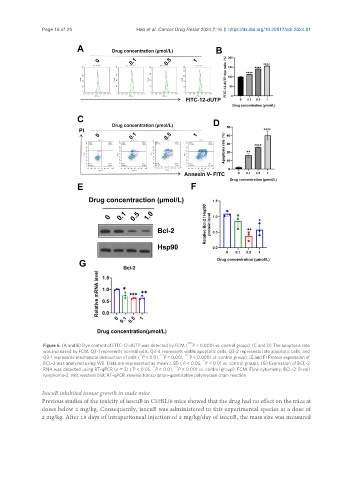
Figure 6. (A and B) Dye content of FITC-12-dUTP was detected by FCM ( **** P < 0.0001 vs. control group); (C and D) The apoptosis rate
was increased by FCM. Q3-1 represents normal cells, Q3-4 represents viable apoptotic cells, Q3-2 represents late apoptotic cells, and
**
***
Q3-1 represents mechanical destruction of cells ( P < 0.01, P < 0.001, **** P < 0.0001 vs. control group); (E and F) Protein expression of
**
*
BCL-2 was analyzed using WB. Data are represented as mean ± SD ( P < 0.05, P < 0.01 vs. control group); (G) Expression of BCL-2
**
***
*
RNA was detected using RT-qPCR (n = 3) ( P < 0.05, P < 0.01, P < 0.001 vs. control group). FCM: Flow cytometry; BCL-2: B-cell
lymphoma-2; WB: western blot; RT-qPCR: reverse transcription-quantitative polymerase chain reaction.
IsocuB inhibited tumor growth in nude mice
Previous studies of the toxicity of isocuB in C57BL/6 mice showed that the drug had no effect on the mice at
doses below 2 mg/kg. Consequently, isocuB was administered to this experimental species at a dose of
2 mg/kg. After 18 days of intraperitoneal injection of 2 mg/kg/day of isocuB, the mass size was measured