
Page 48 - Read Online
P. 48
Page 10 of 25 Han et al. Cancer Drug Resist 2024;7:16 https://dx.doi.org/10.20517/cdr.2024.01
*
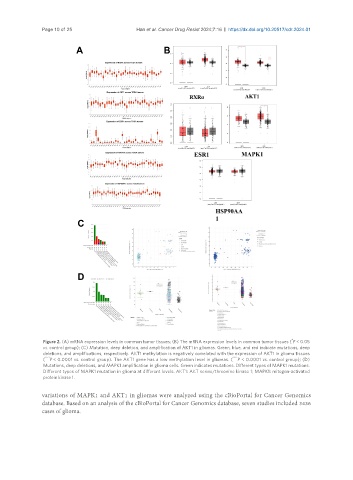
Figure 2. (A) mRNA expression levels in common tumor tissues; (B) The mRNA expression levels in common tumor tissues ( P < 0.05
vs. control group); (C) Mutation, deep deletion, and amplification of AKT1 in gliomas. Green, blue, and red indicate mutations, deep
deletions, and amplifications, respectively. AKT1 methylation is negatively correlated with the expression of AKT1 in glioma tissues
( **** P < 0.0001 vs. control group). The AKT1 gene has a low methylation level in gliomas. ( **** P < 0.0001 vs. control group); (D)
Mutations, deep deletions, and MAPK1 amplification in glioma cells. Green indicates mutations. Different types of MAPK1 mutations.
Different types of MAPK1 mutation in glioma at different levels. AKT1: AKT serine/threonine kinase 1; MAPK1: mitogen-activated
protein kinase 1.
variations of MAPK1 and AKT1 in gliomas were analyzed using the cBioPortal for Cancer Genomics
database. Based on an analysis of the cBioPortal for Cancer Genomics database, seven studies included 3436
cases of glioma.