
Page 45 - Read Online
P. 45
Han et al. Cancer Drug Resist 2024;7:16 https://dx.doi.org/10.20517/cdr.2024.01 Page 7 of 25
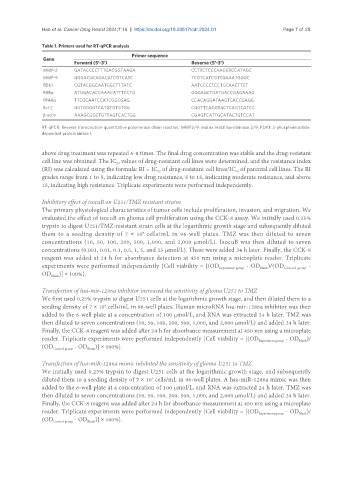
Table 1. Primers used for RT-qPCR analysis
Primer sequence
Gene
Forward (5’-3’) Reverse (5’-3’)
MMP-2 GATACCCCTTTGACGGTAAGA CCTTCTCCCAAGGTCCATAGC
MMP-9 GGGACGCAGACATCGTCATC TCGTCATCGTCGAAATGGGC
PDK1 CGTACGGCAATGGCTTTATC AATCCCCTCCTGCAACTTCT
RXRα ATGGACACCAAACATTTCCTG GGGAGCTGATGACCGAGAAAG
PPARα TTCGCAATCCATCGGCGAG CCACAGGATAAGTCACCGAGG
Bcl-2 GGTGGGGTCATGTGTGTGG CGGTTCAGGTACTCAGTCATCC
β-actin AAAGCGGCTGTTAGTCACTGG CGAGTCATTGCATACTGTCCAT
RT-qPCR: Reverse transcription-quantitative polymerase chain reaction; MMP2/9: matrix metalloproteinase 2/9; PDK1: 3-phosphoinositide-
dependent protein kinase 1.
above drug treatment was repeated 6-8 times. The final drug concentration was stable and the drug-resistant
cell line was obtained. The IC values of drug-resistant cell lines were determined, and the resistance index
50
(RI) was calculated using the formula: RI = IC of drug-resistant cell lines/IC of parental cell lines. The RI
50
50
grades range from 1 to 5, indicating low drug resistance, 5 to 15, indicating moderate resistance, and above
15, indicating high resistance. Triplicate experiments were performed independently.
Inhibitory effect of isocuB on U251/TMZ resistant strains
The primary physiological characteristics of tumor cells include proliferation, invasion, and migration. We
evaluated the effect of isocuB on glioma cell proliferation using the CCK-8 assay. We initially used 0.25%
trypsin to digest U251/TMZ-resistant strain cells at the logarithmic growth stage and subsequently diluted
them to a seeding density of 7 × 10 cells/mL in 96-well plates. TMZ was then diluted to seven
4
concentrations (10, 50, 100, 200, 500, 1,000, and 2,000 µmol/L). IsocuB was then diluted to seven
concentrations (0.001, 0.01, 0.1, 0.5, 1, 5, and 25 µmol/L). These were added 24 h later. Finally, the CCK-8
reagent was added at 24 h for absorbance detection at 450 nm using a microplate reader. Triplicate
experiments were performed independently {Cell viability = [(OD Experiment group - OD Blank )/(OD Control group -
OD Blank )] × 100%}.
Transfection of hsa-mir-1286a inhibitor increased the sensitivity of glioma U251 to TMZ
We first used 0.25% trypsin to digest U251 cells at the logarithmic growth stage, and then diluted them to a
seeding density of 7 × 10 cells/mL in 96-well plates. Human microRNA hsa-mir-1286a inhibitor was then
4
added to the 6-well plate at a concentration of 100 µmol/L, and RNA was extracted 24 h later. TMZ was
then diluted to seven concentrations (10, 50, 100, 200, 500, 1,000, and 2,000 µmol/L) and added 24 h later.
Finally, the CCK-8 reagent was added after 24 h for absorbance measurement at 450 nm using a microplate
reader. Triplicate experiments were performed independently {Cell viability = [(OD Experiment group - OD Blank )/
(OD Control group - OD Blank )] × 100%}.
Transfection of hsa-miR-1286a mimic inhibited the sensitivity of glioma U251 to TMZ
We initially used 0.25% trypsin to digest U251 cells at the logarithmic growth stage, and subsequently
diluted them to a seeding density of 7 × 10 cells/mL in 96-well plates. A hsa-miR-1286a mimic was then
4
added to the 6-well plate at a concentration of 100 µmol/L, and RNA was extracted 24 h later. TMZ was
then diluted to seven concentrations (10, 50, 100, 200, 500, 1,000, and 2,000 µmol/L) and added 24 h later.
Finally, the CCK-8 reagent was added after 24 h for absorbance measurement at 450 nm using a microplate
reader. Triplicate experiments were performed independently {Cell viability = [(OD Experiment group - OD Blank )/
(OD Control group - OD Blank )] × 100%}.