
Page 47 - Read Online
P. 47
Han et al. Cancer Drug Resist 2024;7:16 https://dx.doi.org/10.20517/cdr.2024.01 Page 9 of 25
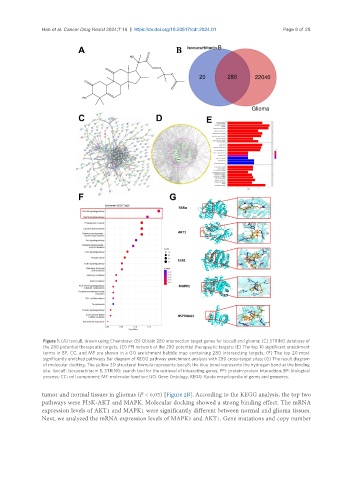
Figure 1. (A) IsocuB, drawn using Chemdraw; (B) Obtain 280 intersection target genes for isocuB and glioma; (C) STRING database of
the 280 potential therapeutic targets; (D) PPI network of the 280 potential therapeutic targets; (E) The top 10 significant enrichment
terms in BP, CC, and MF are shown in a GO enrichment bubble map containing 280 intersecting targets; (F) The top 20 most
significantly enriched pathways Bar diagram of KEGG pathway enrichment analysis with 280 cross-target sites; (G) The result diagram
of molecular docking. The yellow 3D structural formula represents isocuB; the blue bond represents the hydrogen bond at the binding
site. IsocuB: Isocucurbitacin B; STRING: search tool for the retrieval of interacting genes; PPI: protein-protein interaction; BP: biological
process; CC: cell component; MF: molecular function; GO: Gene Ontology; KEGG: Kyoto encyclopedia of genes and genomes.
tumor and normal tissues in gliomas (P < 0.05) [Figure 2B]. According to the KEGG analysis, the top two
pathways were PI3K-AKT and MAPK. Molecular docking showed a strong binding effect. The mRNA
expression levels of AKT1 and MAPK1 were significantly different between normal and glioma tissues.
Next, we analyzed the mRNA expression levels of MAPK1 and AKT1. Gene mutations and copy number