


Page 55 - Read Online
P. 55
Goyal et al. Art Int Surg. 2025;5:450-64  https://dx.doi.org/10.20517/ais.2024.108  Page 458

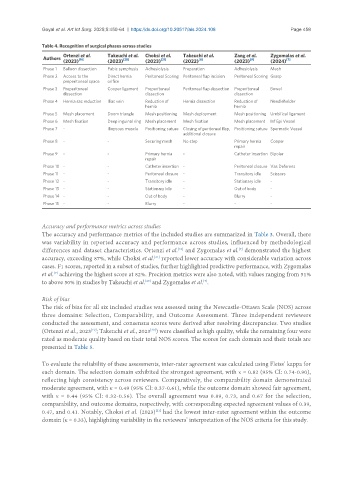
               Table 4. Recognition of surgical phases across studies
                      Ortenzi et al.   Takeuchi et al.   Choksi et al.   Takeuchi et al.   Zang et al.   Zygomalas et al.
                Authors     [10]           [20]        [21]         [8]              [9]          [7]
                      (2023)         (2023)       (2023)       (2022)           (2023)      (2024)
                Phase 1  Balloon dissection  Pubic symphysis  Adhesiolysis  Preparation  Adhesiolysis  Mesh
                Phase 2  Access to the   Direct hernia   Peritoneal Scoring Peritoneal flap incision  Peritoneal Scoring Grasp
                      preperitoneal space  orifice
                Phase 3  Preperitoneal   Cooper ligament  Preperitoneal   Peritoneal flap dissection  Preperitoneal   Bowel
                      dissection                  dissection                    dissection
                Phase 4  Hernia sac reduction  Iliac vein  Reduction of   Hernia dissection  Reduction of   Needleholder
                                                  hernia                        hernia
                Phase 5  Mesh placement  Doom triangle  Mesh positioning  Mesh deployment  Mesh positioning Umbilical ligament
                Phase 6  Mesh fixation  Deep inguinal ring Mesh placement  Mesh fixation  Mesh placement  Inf Epi Vessel
                Phase 7  -           Iliopsoas muscle  Positioning suture  Closing of peritoneal flap,  Positioning suture Spermatic Vessel
                                                               additional closure
                Phase 8  -           -            Securing mesh  No step        Primary hernia   Cooper
                                                                                repair
                Phase 9  -           -            Primary hernia   -            Catheter insertion Bipolar
                                                  repair
                Phase 10 -           -            Catheter insertion -          Peritoneal closure Vas Deferens
                Phase 11  -          -            Peritoneal closure  -         Transitory idle  Scissors
                Phase 12 -           -            Transitory idle  -            Stationary idle  -
                Phase 13 -           -            Stationary idle  -            Out of body  -
                Phase 14 -           -            Out of body  -                Blurry      -
                Phase 15 -           -            Blurry       -                -           -


               Accuracy and performance metrics across studies
               The accuracy and performance metrics of the included studies are summarized in Table 3. Overall, there
               was variability in reported accuracy and performance across studies, influenced by methodological
                                                             [10]
               differences and dataset characteristics. Ortenzi et al.  and Zygomalas et al.  demonstrated the highest
                                                                                 [7]
               accuracy, exceeding 87%, while Choksi et al.  reported lower accuracy with considerable variation across
                                                     [21]
               cases. F1 scores, reported in a subset of studies, further highlighted predictive performance, with Zygomalas
               et al.  achieving the highest score at 82%. Precision metrics were also noted, with values ranging from 51%
                   [7]
                                                  [20]
               to above 50% in studies by Takeuchi et al.  and Zygomalas et al. .
                                                                      [7]
               Risk of bias
               The risk of bias for all six included studies was assessed using the Newcastle-Ottawa Scale (NOS) across
               three domains: Selection, Comparability, and Outcome Assessment. Three independent reviewers
               conducted the assessment, and consensus scores were derived after resolving discrepancies. Two studies
                                [10]
               (Ortenzi et al., 2023 ; Takeuchi et al., 2023 ) were classified as high quality, while the remaining four were
                                                    [20]
               rated as moderate quality based on their total NOS scores. The scores for each domain and their totals are
               presented in Table 5.

               To evaluate the reliability of these assessments, inter-rater agreement was calculated using Fleiss’ kappa for
               each domain. The selection domain exhibited the strongest agreement, with κ = 0.82 (95% CI: 0.74-0.90),
               reflecting high consistency across reviewers. Comparatively, the comparability domain demonstrated
               moderate agreement, with κ = 0.49 (95% CI: 0.37-0.61), while the outcome domain showed fair agreement,
               with κ = 0.44 (95% CI: 0.32-0.56). The overall agreement was 0.89, 0.73, and 0.67 for the selection,
               comparability, and outcome domains, respectively, with corresponding expected agreement values of 0.39,
               0.47, and 0.41. Notably, Choksi et al. (2023)  had the lowest inter-rater agreement within the outcome
                                                     [21]
               domain (κ = 0.33), highlighting variability in the reviewers’ interpretation of the NOS criteria for this study.

