
Page 27 - Read Online
P. 27
Ying et al. Microstructures 2023;3:2023018 https://dx.doi.org/10.20517/microstructures.2022.47 Page 7 of 15
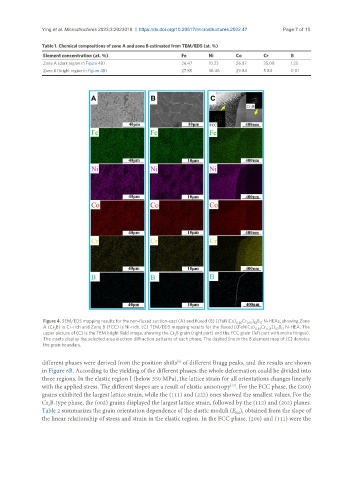
Table 1. Chemical compositions of zone A and zone B estimated from TEM/EDS (at. %)
Element concentration (at. %) Fe Ni Co Cr B
Zone A (dark region in Figure 4B) 26.47 10.33 26.87 35.08 1.25
Zone B (bright region in Figure 4B) 27.85 36.46 29.84 5.84 0.01
] B N-HEAs, showing Zone
Figure 4. SEM/EDS mapping results for the non-fluxed suction-cast (A) and fluxed (B) [(FeNiCo) 0.85 Cr 0.15 83 17
A (Cr B) is Cr-rich and Zone B (FCC) is Ni-rich. (C) TEM/EDS mapping results for the fluxed [(FeNiCo) 0.85 Cr 0.15 ]) B N-HEA. The
83 17
2
upper picture of (C) is the TEM bright field image, showing the Cr B grain (right part) and the FCC grain (left part with moire fringes).
2
The insets display the selected area electron diffraction patterns of each phase. The dashed line in the B element map of (C) denotes
the grain boundary.
different phases were derived from the position shifts of different Bragg peaks, and the results are shown
[6]
in Figure 6B. According to the yielding of the different phases, the whole deformation could be divided into
three regions. In the elastic region I (below 350 MPa), the lattice strain for all orientations changes linearly
with the applied stress. The different slopes are a result of elastic anisotropy . For the FCC phase, the (200)
[33]
grains exhibited the largest lattice strain, while the (111) and (222) ones showed the smallest values. For the
Cr B-type phase, the (002) grains displayed the largest lattice strain, followed by the (112) and (202) planes.
2
Table 2 summarizes the grain orientation dependence of the elastic moduli (E ), obtained from the slope of
hkl
the linear relationship of stress and strain in the elastic region. In the FCC phase, (200) and (111) were the