
Page 24 - Read Online
P. 24
Page 4 of 15 Ying et al. Microstructures 2023;3:2023018 https://dx.doi.org/10.20517/microstructures.2022.47
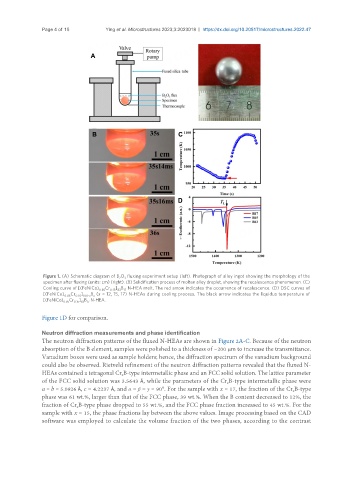
Figure 1. (A) Schematic diagram of B O fluxing experiment setup (left). Photograph of alloy ingot showing the morphology of the
2 3
specimen after fluxing (units: cm) (right). (B) Solidification process of molten alloy droplet, showing the recalescence phenomenon. (C)
Cooling curve of [(FeNiCo) Cr ] B N-HEA melt. The red arrow indicates the occurrence of recalescence. (D) DSC curves of
0.85 0.15 83 17
[(FeNiCo) Cr ] B (x = 12, 15, 17) N-HEAs during cooling process. The black arrow indicates the liquidus temperature of
0.85 0.15 100-x x
[(FeNiCo) Cr ] B N-HEA.
0.85 0.15 83 17
Figure 1D for comparison.
Neutron diffraction measurements and phase identification
The neutron diffraction patterns of the fluxed N-HEAs are shown in Figure 2A-C. Because of the neutron
absorption of the B element, samples were polished to a thickness of ~200 μm to increase the transmittance.
Vanadium boxes were used as sample holders; hence, the diffraction spectrum of the vanadium background
could also be observed. Rietveld refinement of the neutron diffraction patterns revealed that the fluxed N-
HEAs contained a tetragonal Cr B-type intermetallic phase and an FCC solid solution. The lattice parameter
2
of the FCC solid solution was 3.5643 Å, while the parameters of the Cr B-type intermetallic phase were
2
a = b = 5.0926 Å, c = 4.2237 Å, and α = β = γ = 90°. For the sample with x = 17, the fraction of the Cr B-type
2
phase was 61 wt.%, larger than that of the FCC phase, 39 wt.%. When the B content decreased to 12%, the
fraction of Cr B-type phase dropped to 55 wt.%, and the FCC phase fraction increased to 45 wt.%. For the
2
sample with x = 15, the phase fractions lay between the above values. Image processing based on the CAD
software was employed to calculate the volume fraction of the two phases, according to the contrast