
Page 26 - Read Online
P. 26
Page 6 of 15 Ying et al. Microstructures 2023;3:2023018 https://dx.doi.org/10.20517/microstructures.2022.47
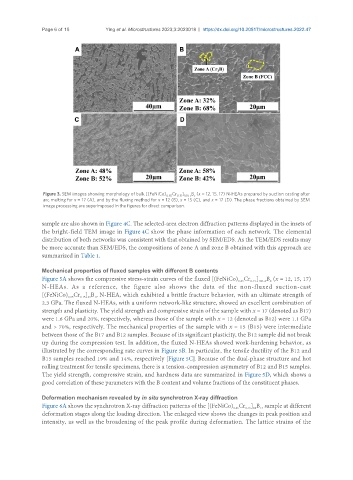
Figure 3. SEM images showing morphology of bulk [(FeNiCo) 0.85 Cr 0.15 100-x x
B (x = 12, 15, 17) N-HEAs prepared by suction casting after
]
arc melting for x = 17 (A), and by the fluxing method for x = 12 (B), x = 15 (C), and x = 17 (D). The phase fractions obtained by SEM
image processing are superimposed in the figures for direct comparison.
sample are also shown in Figure 4C. The selected-area electron diffraction patterns displayed in the insets of
the bright-field TEM image in Figure 4C show the phase information of each network. The elemental
distribution of both networks was consistent with that obtained by SEM/EDS. As the TEM/EDS results may
be more accurate than SEM/EDS, the compositions of zone A and zone B obtained with this approach are
summarized in Table 1.
Mechanical properties of fluxed samples with different B contents
Figure 5A shows the compressive stress-strain curves of the fluxed [(FeNiCo) Cr ] B (x = 12, 15, 17)
0.15 100-x x
0.85
N-HEAs. As a reference, the figure also shows the data of the non-fluxed suction-cast
[(FeNiCo) Cr ] B N-HEA, which exhibited a brittle fracture behavior, with an ultimate strength of
0.85
0.15 83 17
2.3 GPa. The fluxed N-HEAs, with a uniform network-like structure, showed an excellent combination of
strength and plasticity. The yield strength and compressive strain of the sample with x = 17 (denoted as B17)
were 1.6 GPa and 20%, respectively, whereas those of the sample with x = 12 (denoted as B12) were 1.1 GPa
and > 70%, respectively. The mechanical properties of the sample with x = 15 (B15) were intermediate
between those of the B17 and B12 samples. Because of its significant plasticity, the B12 sample did not break
up during the compression test. In addition, the fluxed N-HEAs showed work-hardening behavior, as
illustrated by the corresponding rate curves in Figure 5B. In particular, the tensile ductility of the B12 and
B15 samples reached 19% and 14%, respectively [Figure 5C]. Because of the dual-phase structure and hot
rolling treatment for tensile specimens, there is a tension-compression asymmetry of B12 and B15 samples.
The yield strength, compressive strain, and hardness data are summarized in Figure 5D, which shows a
good correlation of these parameters with the B content and volume fractions of the constituent phases.
Deformation mechanism revealed by in situ synchrotron X-ray diffraction
Figure 6A shows the synchrotron X-ray diffraction patterns of the [(FeNiCo) Cr ] B sample at different
0.15 88 12
0.85
deformation stages along the loading direction. The enlarged view shows the changes in peak position and
intensity, as well as the broadening of the peak profile during deformation. The lattice strains of the