
Page 25 - Read Online
P. 25
Ying et al. Microstructures 2023;3:2023018 https://dx.doi.org/10.20517/microstructures.2022.47 Page 5 of 15
B N-HEAs, with x = 17 (A),
]
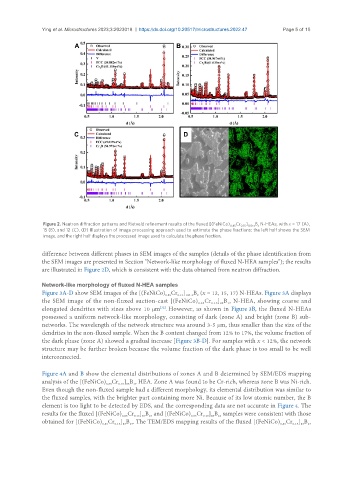
Figure 2. Neutron diffraction patterns and Rietveld refinement results of the fluxed [(FeNiCo) 0.85 Cr 0.15 100-x x
15 (B), and 12 (C). (D) Illustration of image processing approach used to estimate the phase fractions; the left half shows the SEM
image, and the right half displays the processed image used to calculate the phase fraction.
difference between different phases in SEM images of the samples (details of the phase identification from
the SEM images are presented in Section "Network-like morphology of fluxed N-HEA samples"); the results
are illustrated in Figure 2D, which is consistent with the data obtained from neutron diffraction.
Network-like morphology of fluxed N-HEA samples
Figure 3A-D show SEM images of the [(FeNiCo) Cr ] B (x = 12, 15, 17) N-HEAs. Figure 3A displays
0.15 100-x x
0.85
the SEM image of the non-fluxed suction-cast [(FeNiCo) Cr ] B N-HEA, showing coarse and
0.85
0.15 83 17
elongated dendrites with sizes above 10 μm . However, as shown in Figure 3B, the fluxed N-HEAs
[32]
possessed a uniform network-like morphology, consisting of dark (zone A) and bright (zone B) sub-
networks. The wavelength of the network structure was around 3-5 μm, thus smaller than the size of the
dendrites in the non-fluxed sample. When the B content changed from 12% to 17%, the volume fraction of
the dark phase (zone A) showed a gradual increase [Figure 3B-D]. For samples with x < 12%, the network
structure may be further broken because the volume fraction of the dark phase is too small to be well
interconnected.
Figure 4A and B show the elemental distributions of zones A and B determined by SEM/EDS mapping
analysis of the [(FeNiCo) Cr ] B HEA. Zone A was found to be Cr-rich, whereas zone B was Ni-rich.
0.15 83 17
0.85
Even though the non-fluxed sample had a different morphology, its elemental distribution was similar to
the fluxed samples, with the brighter part containing more Ni. Because of its low atomic number, the B
element is too light to be detected by EDS, and the corresponding data are not accurate in Figure 4. The
results for the fluxed [(FeNiCo) Cr ] B and [(FeNiCo) Cr ] B samples were consistent with those
0.15 85 15
0.15 88 12
0.85
0.85
obtained for [(FeNiCo) Cr ] B . The TEM/EDS mapping results of the fluxed [(FeNiCo) Cr ] B
0.85
0.15 83 17
0.85
0.15 83 17