
Page 170 - Read Online
P. 170
Ge et al. Microstructures 2023;3:2023026 https://dx.doi.org/10.20517/microstructures.2023.13 Page 5 of 10
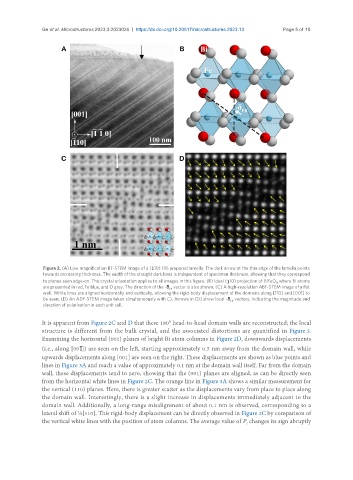
Figure 2. (A) Low magnification BF-STEM image of a ( 10) FIB-prepared lamella. The dark arrow at the thin edge of the lamella points
towards increasing thickness. The width of the straight dark lines is independent of specimen thickness, showing that they correspond
to planes seen edge-on. The crystal orientation applies to all images in this figure. (B) Ideal ( 10) projection of BiFeO , where Bi atoms
3
are presented in red, Fe blue, and O grey. The direction of the -δ vector is also shown. (C) A high-resolution ABF-STEM image of a flat
FB
wall. White lines are aligned horizontally and vertically, allowing the rigid-body displacement of the domains along [110] and [001] to
be seen. (D) An ADF-STEM image taken simultaneously with C). Arrows in (D) show local -δ vectors, indicating the magnitude and
FB
direction of polarisation in each unit cell.
It is apparent from Figure 2C and D that these 180° head-to-head domain walls are reconstructed; the local
structure is different from the bulk crystal, and the associated distortions are quantified in Figure 3.
Examining the horizontal (001) planes of bright Bi atom columns in Figure 2D, downwards displacements
(i.e., along [00 ]) are seen on the left, starting approximately 0.5 nm away from the domain wall, while
upwards displacements along [001] are seen on the right. These displacements are shown as blue points and
lines in Figure 3A and reach a value of approximately 0.1 nm at the domain wall itself. Far from the domain
wall, these displacements tend to zero, showing that the (001) planes are aligned, as can be directly seen
from the horizontal white lines in Figure 2C. The orange line in Figure 3A shows a similar measurement for
the vertical (110) planes. Here, there is greater scatter as the displacements vary from place to place along
the domain wall. Interestingly, there is a slight increase in displacements immediately adjacent to the
domain wall. Additionally, a long-range misalignment of about 0.1 nm is observed, corresponding to a
lateral shift of ½[110]. This rigid-body displacement can be directly observed in Figure 2C by comparison of
the vertical white lines with the position of atom columns. The average value of P changes its sign abruptly
s