
Page 105 - Read Online
P. 105
Page 4 of 10 Wang et al. Microstructures 2023;3:2023023 https://dx.doi.org/10.20517/microstructures.2023.04
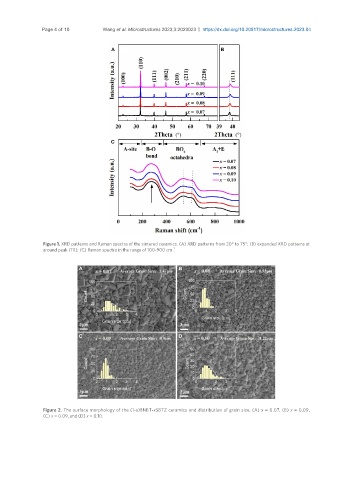
Figure 1. XRD patterns and Raman spectra of the sintered ceramics. (A) XRD patterns from 20° to 75°; (B) expanded XRD patterns at
-1
around peak (111); (C) Raman spectra in the range of 100-900 cm .
Figure 2. The surface morphology of the (1-x)BNBT-xSBTZ ceramics and distribution of grain size. (A) x = 0.07, (B) x = 0.09,
(C) x = 0.09, and (D) x = 0.10.