
Page 108 - Read Online
P. 108
Wang et al. Microstructures 2023;3:2023023 https://dx.doi.org/10.20517/microstructures.2023.04 Page 7 of 10
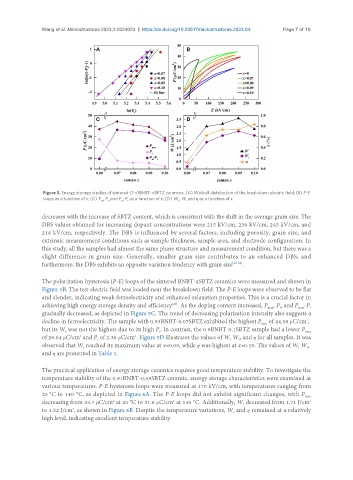
Figure 5. Energy storage studies of sintered (1-x)BNBT-xSBTZ ceramics. (A) Weibull distribution of the breakdown electric field; (B) P-E
loops as a function of x; (C) P , P , and P -P as a function of x; (D) W , W, and η as a function of x.
m
r
m
r
r
decreases with the increase of SBTZ content, which is consistent with the shift in the average grain size. The
DBS values obtained for increasing dopant concentrations were 215 kV/cm, 230 kV/cm, 245 kV/cm, and
218 kV/cm, respectively. The DBS is influenced by several factors, including porosity, grain size, and
extrinsic measurement conditions such as sample thickness, sample area, and electrode configuration. In
this study, all the samples had almost the same phase structure and measurement condition, but there was a
slight difference in grain size. Generally, smaller grain size contributes to an enhanced DBS, and
furthermore, the DBS exhibits an opposite variation tendency with grain size [23-25] .
The polarization hysteresis (P-E) loops of the sintered BNBT-xSBTZ ceramics were measured and shown in
Figure 5B. The test electric field was loaded near the breakdown field. The P-E loops were observed to be flat
and slender, indicating weak ferroelectricity and enhanced relaxation properties. This is a crucial factor in
achieving high energy storage density and efficiency . As the doping content increased, P , P , and P -P
[26]
max
max
r
r
gradually decreased, as depicted in Figure 5C. The trend of decreasing polarization intensity also suggests a
decline in ferroelectricity. The sample with 0.93BNBT-0.07SBTZ exhibited the highest P of 44.38 μC/cm ,
2
max
but its W was not the highest due to its high P . In contrast, the 0.9BNBT-0.1SBTZ sample had a lower P
r
max
r
2
of 29.04 μC/cm and P of 2.36 μC/cm . Figure 5D illustrates the values of W, W , and η for all samples. It was
2
r
r
observed that W reached its maximum value at x=0.09, while η was highest at x=0.10. The values of W, W ,
r
r
and η are presented in Table 1.
The practical application of energy storage ceramics requires good temperature stability. To investigate the
temperature stability of the 0.91BNBT-0.09SBTZ ceramic, energy storage characteristics were examined at
various temperatures. P-E hysteresis loops were measured at 170 kV/cm, with temperatures ranging from
25 °C to 140 °C, as depicted in Figure 6A. The P-E loops did not exhibit significant changes, with P
max
decreasing from 34.7 μC/cm at 25 °C to 31.6 μC/cm at 140 °C. Additionally, W decreased from 1.71 J/cm
2
3
2
r
3
to 1.52 J/cm , as shown in Figure 6B. Despite the temperature variations, W and η remained at a relatively
r
high level, indicating excellent temperature stability.